


The legend in the InstaSpot team!
Legend! You think that's bombastic rhetoric? But how should we call a man, who became the first Asian to win the junior world chess championship at 18 and who became the first Indian Grandmaster at 19? That was the start of a hard path to the World Champion title for Viswanathan Anand, the man who became a part of history of chess forever. Now one more legend in the InstaSpot team!


Borussia is one of the most titled football clubs in Germany, which has repeatedly proved to fans: the spirit of competition and leadership will certainly lead to success. Trade in the same way that sports professionals play the game: confidently and actively. Keep a "pass" from Borussia FC and be in the lead with InstaSpot!
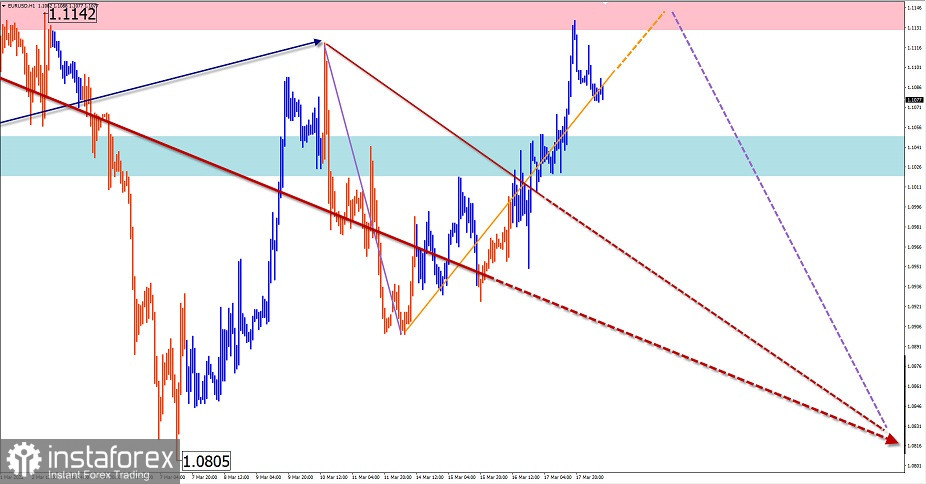
EUR/USD
Analysis:
A downtrend continues on the European currency chart. The last unfinished section in the main direction is counting down from March 9. Since the end of last week, quotations are pulling back up, forming the middle part of the wave (B). At the time of analysis, the price has reached the lower boundary of the potential reversal zone of the large timeframe.
Outlook:
In the next day, the upward movement vector is expected to complete, the formation of the reversal and the resumption of the price decrease. In case of a change of course an increase in volatility and a short-term piercing of the upper border of the estimated resistance is not excluded.
Potential reversal zones
Resistance:
- 1.1130/1.1160
Support:
- 1.1050/1.1020
Recommendations:
The buying potential of the euro market has been exhausted. It is recommended to refrain from trading in the pair until there are confirmed sell signals around the resistance area.
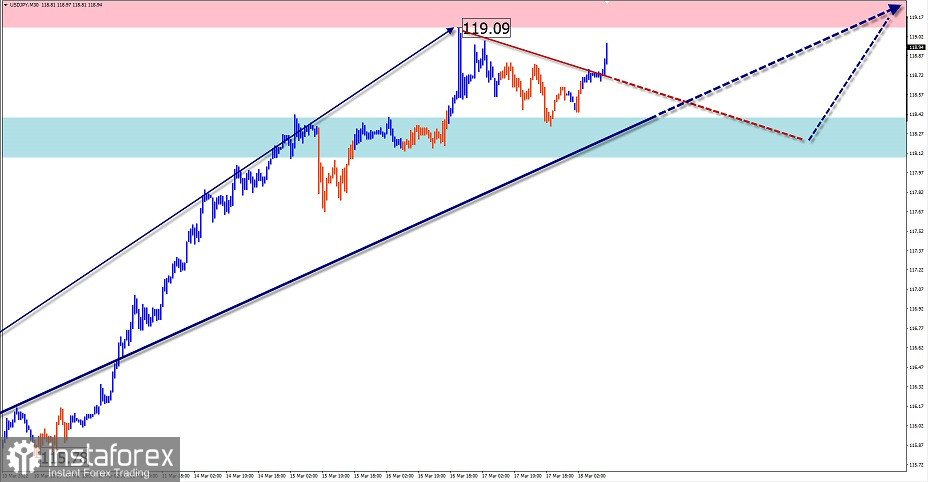
USD/JPY
Analysis:
The Japanese yen has been steadily weakening against the US dollar since the beginning of last year. The latest incomplete section of the rising wave has been reporting since March 4. By now, the quotes have reached the lower border of the strong large scale reversal zone.
Outlook:
In the near term, the movement vector is expected to shift predominantly sideways, between the closest areas of counter direction. After the pressure on the resistance, we can expect the formation of a reversal and a pullback of the price downwards.
Potential reversal zones
Resistance:
- 119.10/119.40
Support:
- 118.40/118.10
Recommendations:
On the current day, trading activity on the Japanese Yen market may lead to losses. It is recommended to refrain from entering the pair's market until the retracement phase is completed.
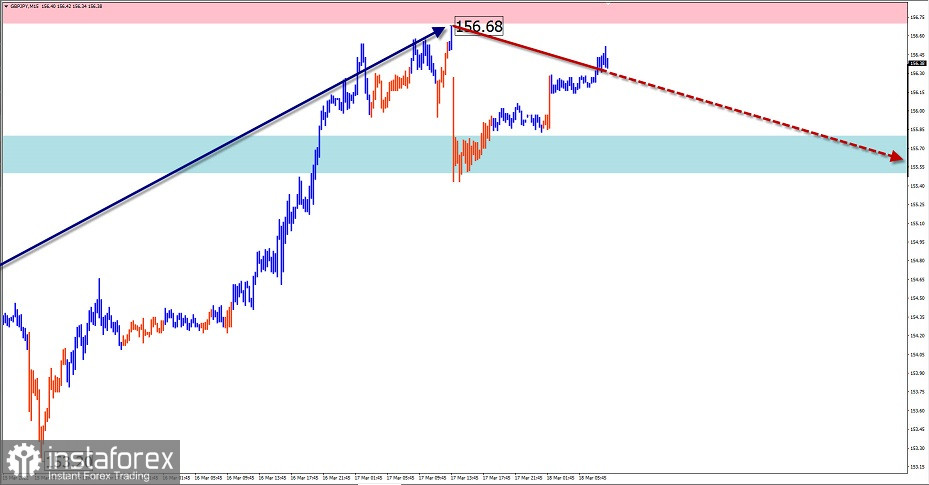
GBP/JPY
Analysis:
The bullish wave level of the March 4 pound/yen chart reached the reversal potential, giving rise to a new wave of the pair's global trend. At the time of analysis, the price has reached the lower border of the powerful weekly scale potential reversal zone.
Outlook:
During the next trading sessions, the quotations are expected to move in the price corridor between the nearest counter zones. In the first half of the day descending course of price movement is more likely. A renewed pressure on resistance is likely at the end of the day or tomorrow.
Potential reversal zones
Resistance:
- 156.70/157.00
Support:
- 155.80/155.50
Recommendations:
In flat conditions, trading the cross is riskier and could become loss-making. It is recommended to refrain from trading in the instrument until there are confirmed buying signals in the area of estimated support.
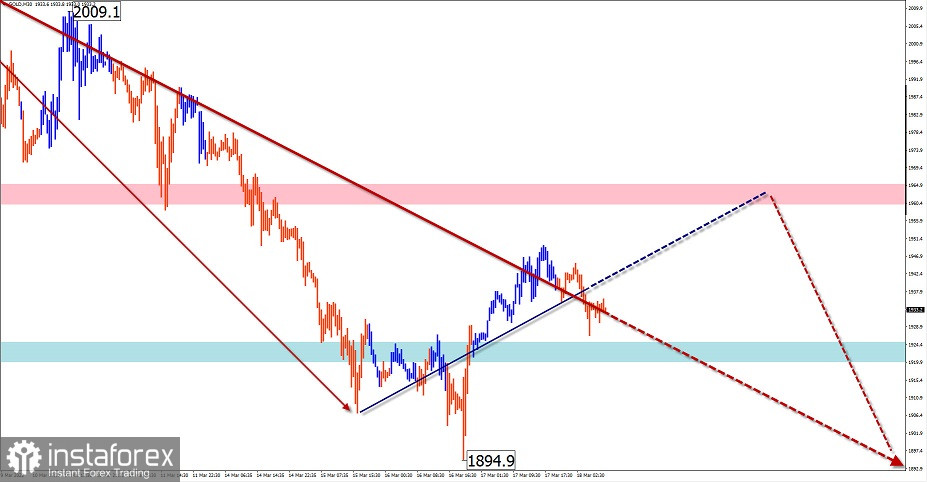
GOLD
Analysis:
After a strong upside phase since March 8, gold is correcting downwards. Since the beginning of this week, an intermediate pullback is forming on the chart. Strong support at $1850/oz could be a likely downside target.
Outlook:
An upward movement of gold is more likely in the first half of the day, with the price rising all the way up to the estimated resistance. At the end of the day or tomorrow, the probability of a reversal and resumption of the downtrend increases.
Potential reversal zones
Resistance:
- 1960.0/1965.0
Support:
- 1925.0/1920.0
Recommendations:
There are no buying conditions in the gold market today. Trading the instrument is not recommended until there are confirmed reversal signals in the resistance area.
Explanation: In simplified wave analysis (SVA), waves consist of 3 parts (A-B-C). The last unfinished wave is analysed. The solid arrow background shows the structure formed. The dotted arrow shows the expected movements.
Attention: The wave algorithm does not take into account the duration of the instrument movements over time!
*这里的市场分析是为了增加您对市场的了解,而不是给出交易的指示。
InstaSpot分析评论将让您充分了解市场趋势! 作为InstaSpot的客户,您将获得大量的免费服务以实现有效的交易。


