


我们的团队有超过700万的操盘手!
我们每天都在一起努力改善交易。我们得到了很高的成绩,并继续前进。
世界各地数以百万计的操盘手的认可是我们工作的最大赞赏! 您做出了您的选择,我们将尽一切努力来满足您的期望!
我们是一个共同的伟大团队!
InstaSpot. 自豪地为您工作!


The Canadian dollar is heading into medium-term weakening. On the weekly chart, the signal line of the Marlin Oscillator reversed upwards from the zero neutral line (arrow), which indicates a prospective probability of a medium-term price increase.
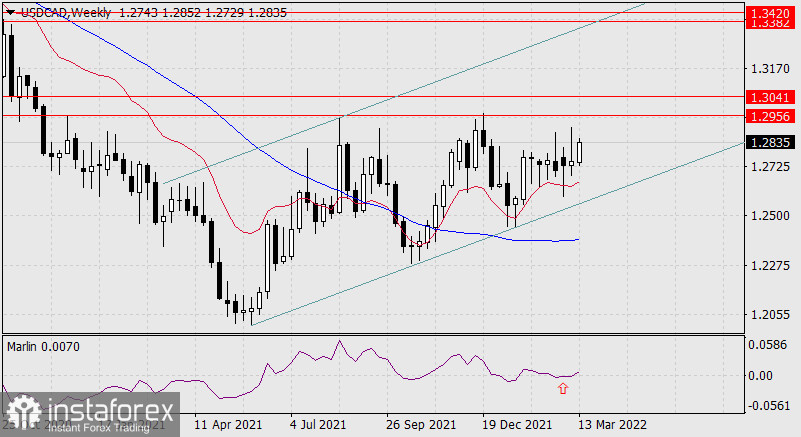
Today is Tuesday, but the current weekly candle has a pronounced rising look. You can even mark the first targets on the weekly timeframe: 1.2956 is the high of December 2020, 1.3041 is the low of November 2019. The strategic goal that we are interested in on the weekly chart is the upper limit of the price channel. The target range is determined by the high of September 2019 and the high of September 2020: 1.3382-1.3420.
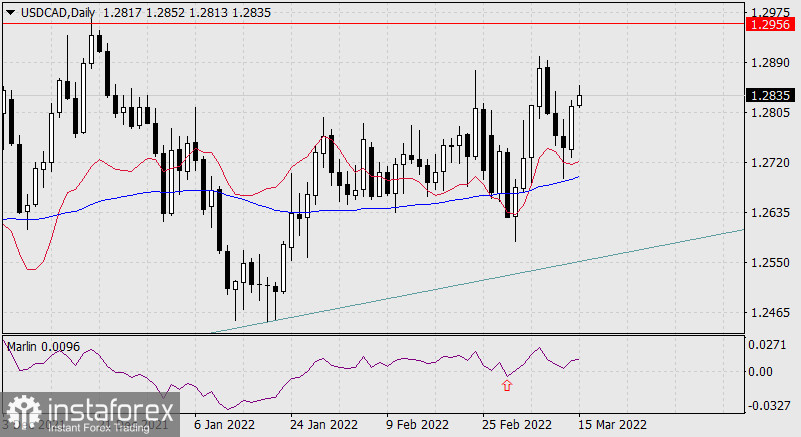
On the daily chart, the Marlin Oscillator began to develop a growing movement after a false short-term retreat into the negative zone (arrow). The price rises above both indicator lines.
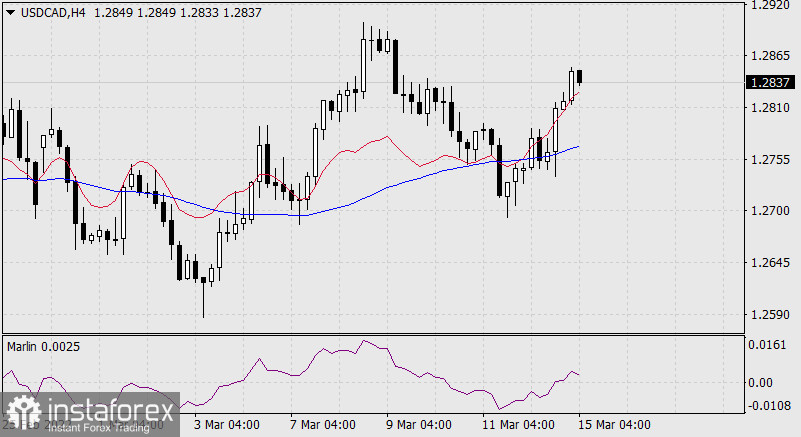
On the H4 chart, the price settled above the lines of balance and MACD, Marlin moved into the positive area. We are waiting for the development of price growth.
*这里的市场分析是为了增加您对市场的了解,而不是给出交易的指示。
InstaSpot分析评论将让您充分了解市场趋势! 作为InstaSpot的客户,您将获得大量的免费服务以实现有效的交易。


