


我们的团队有超过700万的操盘手!
我们每天都在一起努力改善交易。我们得到了很高的成绩,并继续前进。
世界各地数以百万计的操盘手的认可是我们工作的最大赞赏! 您做出了您的选择,我们将尽一切努力来满足您的期望!
我们是一个共同的伟大团队!
InstaSpot. 自豪地为您工作!


A preliminary estimate of UK GDP for the fourth quarter showed a slowdown in economic growth from 6.8% to 6.6%. This is not the best data – the pound was under selling pressure at that time.
Analysis of trading charts from February 11:
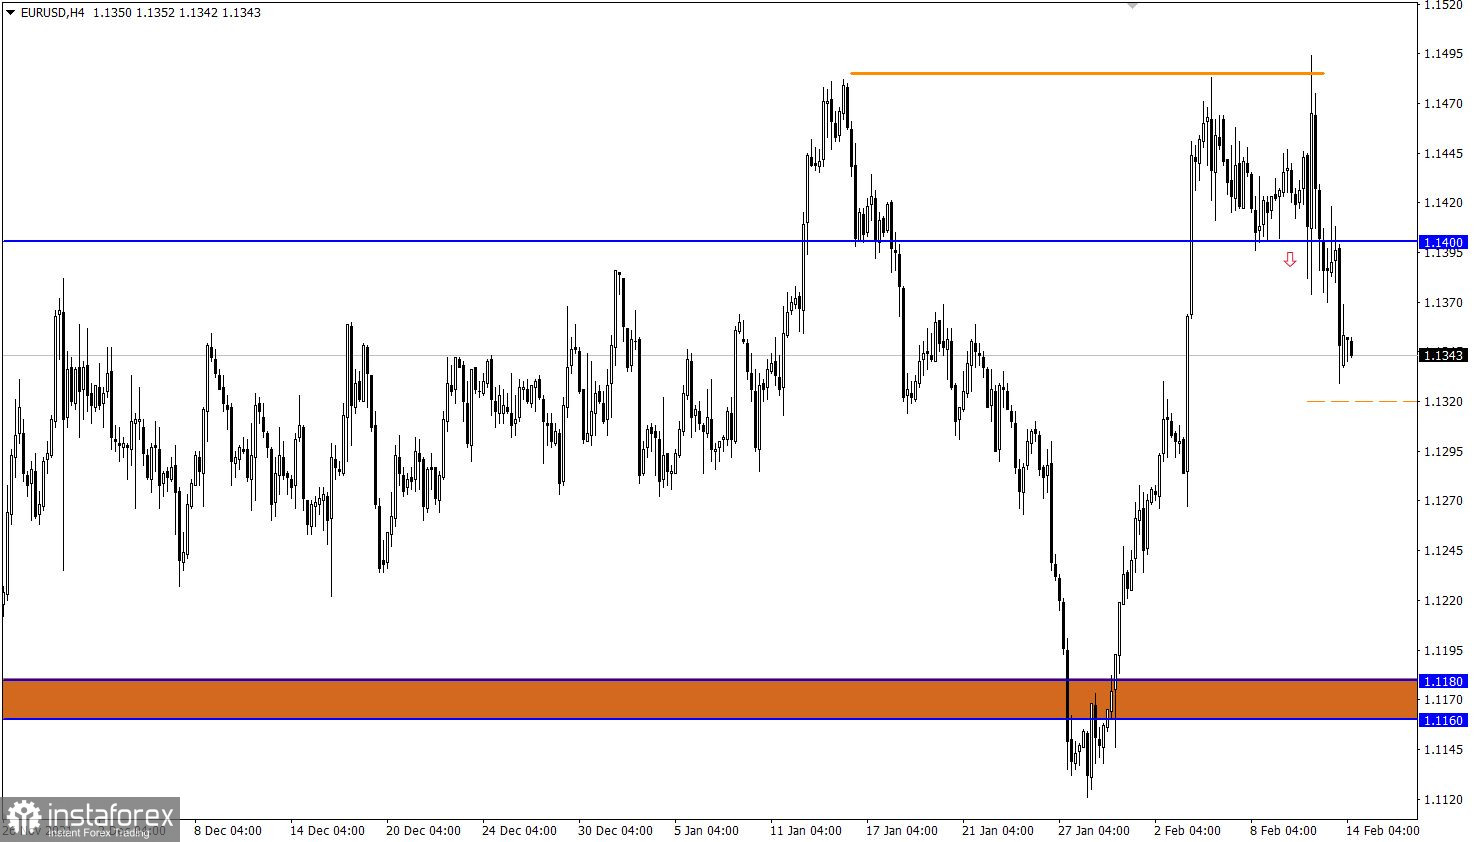
The EUR/USD pair continued to decline after the breakdown of the lower border of the side channel 1.1400/1.1480. This move led to an acceleration in the market, which may give an additional impulse to the process of price recovery relative to the recently completed correction.
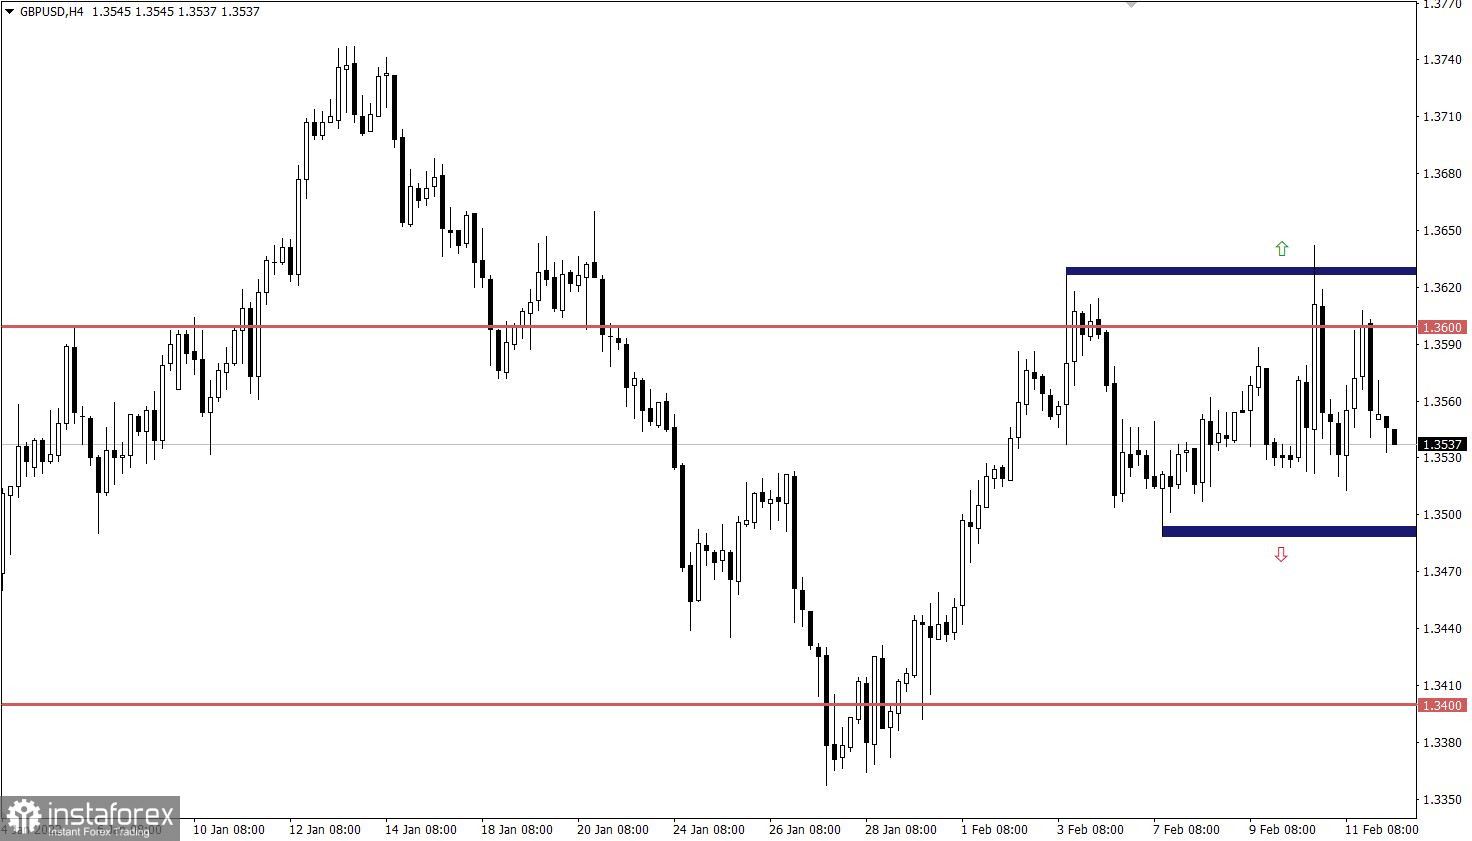
The GBP/USD pair remains within the range of 1.3500/1.3600 despite local price fluctuations. Contrary to the euro's downward trend, the pound is in the accumulation stage of trading forces. This process may lead to an acceleration in the market, where the positive correlation of the pair will be restored.
February 14 economic calendar:
Monday is traditionally accompanied by an empty macroeconomic calendar, but do not get upset. An unscheduled meeting of the Fed Board of Governors is scheduled today, which can lead to market speculation. In this case, it is worth carefully monitoring the information flow for news regarding the outcome of the meeting.
Time targeting
The meeting starts at 19:30 Moscow time
Trading plan for EUR/USD on Feb 14:
In this situation, the signal to sell the euro against the dollar remains, but to strengthen it, the quote needs to stay below the level of 1.1320. In this case, there will be a new round of growth in the volume of short positions, which will lead to the next recovery of the US dollar relative to the recent correction.
An alternative scenario for the development of the market considers speculative activity, based on which the quote may pull back to the lower limit of the previously broken flat.
Trading plan for GBP/USD on Feb 14:
The price movement in the range of 100 points remains in the market. Thus, the best tactic is to wait for the price to settle beyond the control values in a four-hour period.
Let's demonstrate the above into trading signals:
What is reflected in the trading charts?
A candlestick chart view is graphical rectangles of white and black light, with sticks on top and bottom. When analyzing each candle in detail, you will see its characteristics of a relative period: the opening price, closing price, and maximum and minimum prices.
Horizontal levels are price coordinates, relative to which a stop or a price reversal may occur. These levels are called support and resistance in the market.
Circles and rectangles are highlighted examples where the price of the story unfolded. This color selection indicates horizontal lines that may put pressure on the quote in the future.
The up/down arrows are the reference points of the possible price direction in the future.
*这里的市场分析是为了增加您对市场的了解,而不是给出交易的指示。
InstaSpot分析评论将让您充分了解市场趋势! 作为InstaSpot的客户,您将获得大量的免费服务以实现有效的交易。


