


我们的团队有超过700万的操盘手!
我们每天都在一起努力改善交易。我们得到了很高的成绩,并继续前进。
世界各地数以百万计的操盘手的认可是我们工作的最大赞赏! 您做出了您的选择,我们将尽一切努力来满足您的期望!
我们是一个共同的伟大团队!
InstaSpot. 自豪地为您工作!


The macroeconomic calendar yesterday was empty, so traders focused on technical analysis.
Analysis of trading charts from February 8:
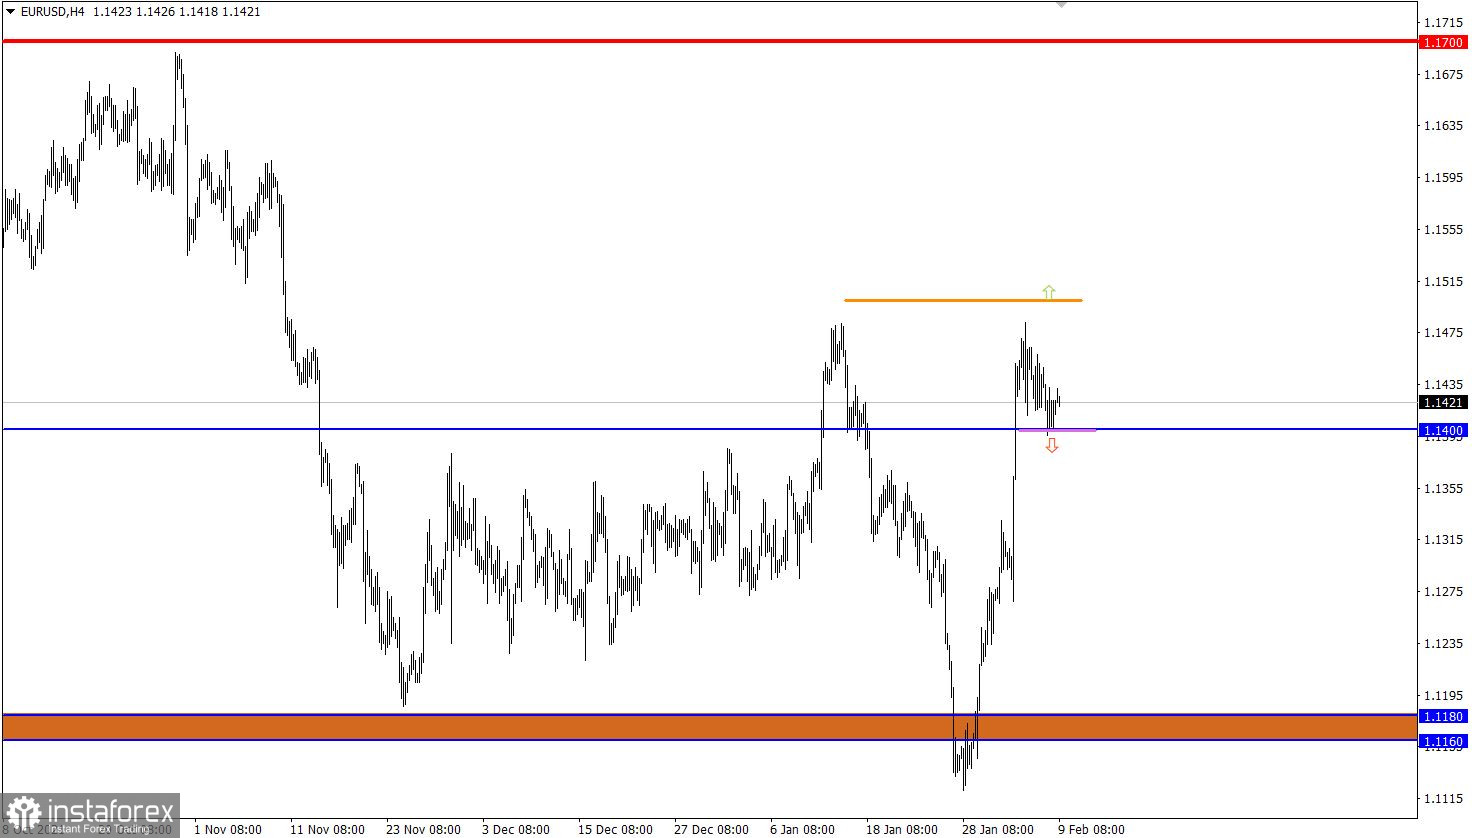
The EUR/USD pair has been stagnating at the peak of the upward cycle for the fourth day in a row. This movement led to a price amplitude in the range of 1.1400/1.1480.
It should be considered that the picture looks different on the daily chart. The upward cycle mentioned above is only a correction in a medium-term downward trend. Therefore, it is impossible to fully discuss the change in trading interests from a downward trend to an upward one.
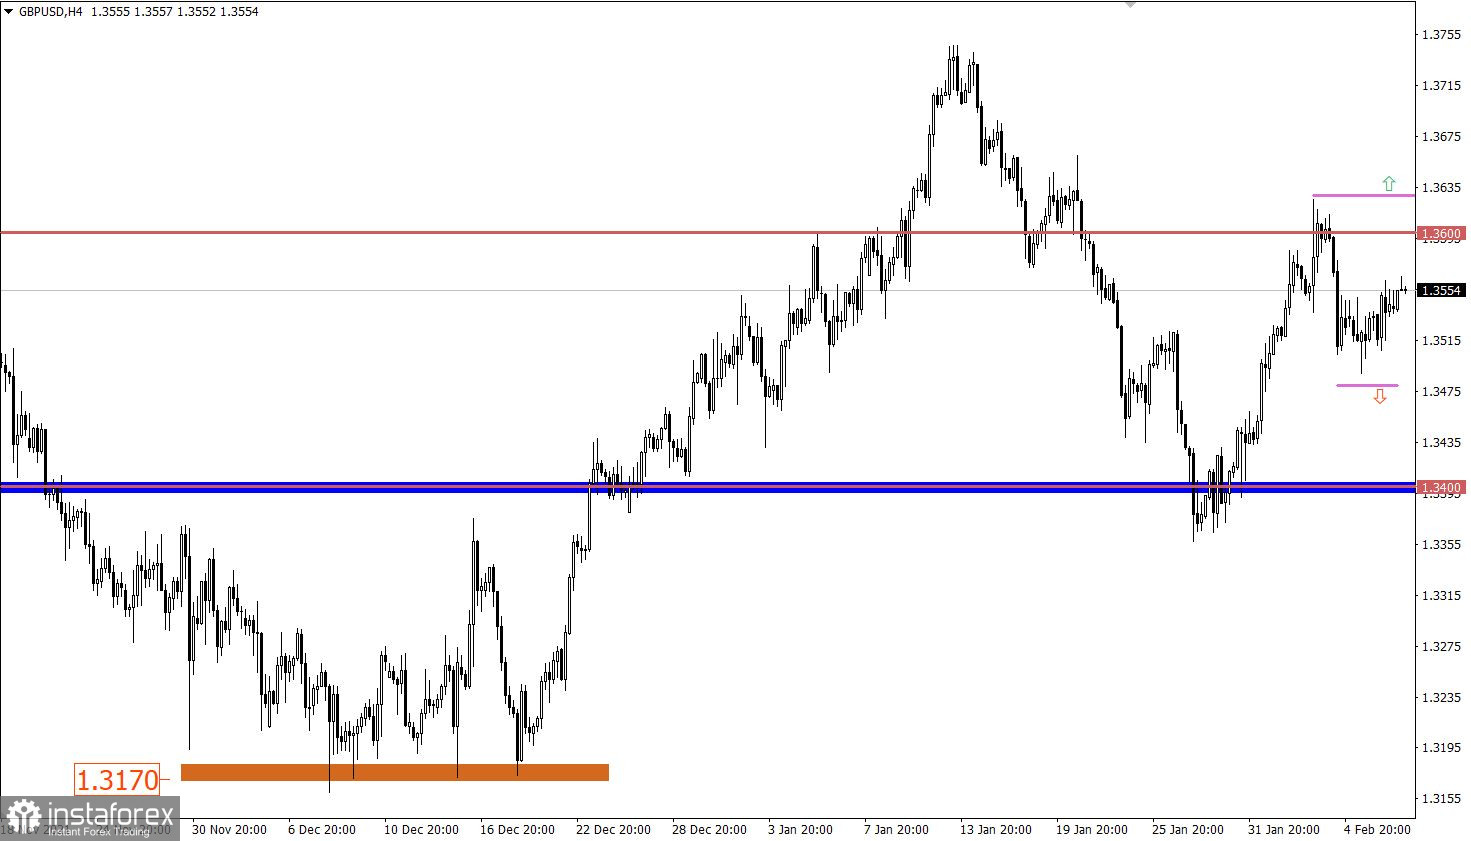
During the price rebound from the resistance level of 1.3600, the GBP/USD pair returned to the level of 1.3500 where a slight stagnation arose. Judging the price's action, it can be said that the upward cycle from the level of 1.3355 remains in the market, in the structure of which there was a regrouping of trading forces.
February 9 economic calendar:
The macroeconomic calendar is empty for three consecutive days, but everything will fall into place tomorrow when US inflation data is released. At this time, traders are still focused on the technical picture, but everything will change soon.
Trading plan for EUR/USD on Feb 9:
The quote is still moving in the range of 1.1400/1.1480. It can be assumed that such a long-term price movement in a closed amplitude will lead to accumulation and regular acceleration when the price is kept outside one or another border of the established range. Therefore, the strategy of trading on the breakdown of a particular flat border in a four-hour period is considered the most appropriate tactic.
We express the above-mentioned into trading signals:
Buy positions should be considered after holding the price above the level of 1.1485 with the prospect of moving to 1.1580.
Sell positions should be considered after holding the price below the level of 1.1400 with the prospect of moving to 1.1350-1.1300.
Trading plan for GBP/USD on Feb 9:
There is still low activity in the market, which may be a signal of the accumulation of trading forces. As a result, traders will trade according to the method of downward impulse relative to the control values. As a result, there will be a signal about the possible direction of the market.
We express the above-mentioned into trading signals:
Buy positions should be considered after holding the price above the level of 1.3630 with the prospect of moving to 1.3740.
Sell positions should be considered after holding the price below the level of 1.3480 with the prospect of moving to 1.3400.
What is reflected in the trading charts?
A candlestick chart view is graphical rectangles of white and black light, with sticks on top and bottom. When analyzing each candle in detail, you will see its characteristics of a relative period: the opening price, closing price, and maximum and minimum prices.
Horizontal levels are price coordinates, relative to which a stop or a price reversal may occur. These levels are called support and resistance in the market.
Circles and rectangles are highlighted examples where the price of the story unfolded. This color selection indicates horizontal lines that may put pressure on the quote in the future.
The up/down arrows are the reference points of the possible price direction in the future.
*这里的市场分析是为了增加您对市场的了解,而不是给出交易的指示。
InstaSpot分析评论将让您充分了解市场趋势! 作为InstaSpot的客户,您将获得大量的免费服务以实现有效的交易。


