


我们的团队有超过700万的操盘手!
我们每天都在一起努力改善交易。我们得到了很高的成绩,并继续前进。
世界各地数以百万计的操盘手的认可是我们工作的最大赞赏! 您做出了您的选择,我们将尽一切努力来满足您的期望!
我们是一个共同的伟大团队!
InstaSpot. 自豪地为您工作!


Eurozone's preliminary GDP data showed that economic growth accelerated from 3.9% to 4.6%, which is a positive factor that stimulated the euro rate.
Analysis of trading charts from January 31:
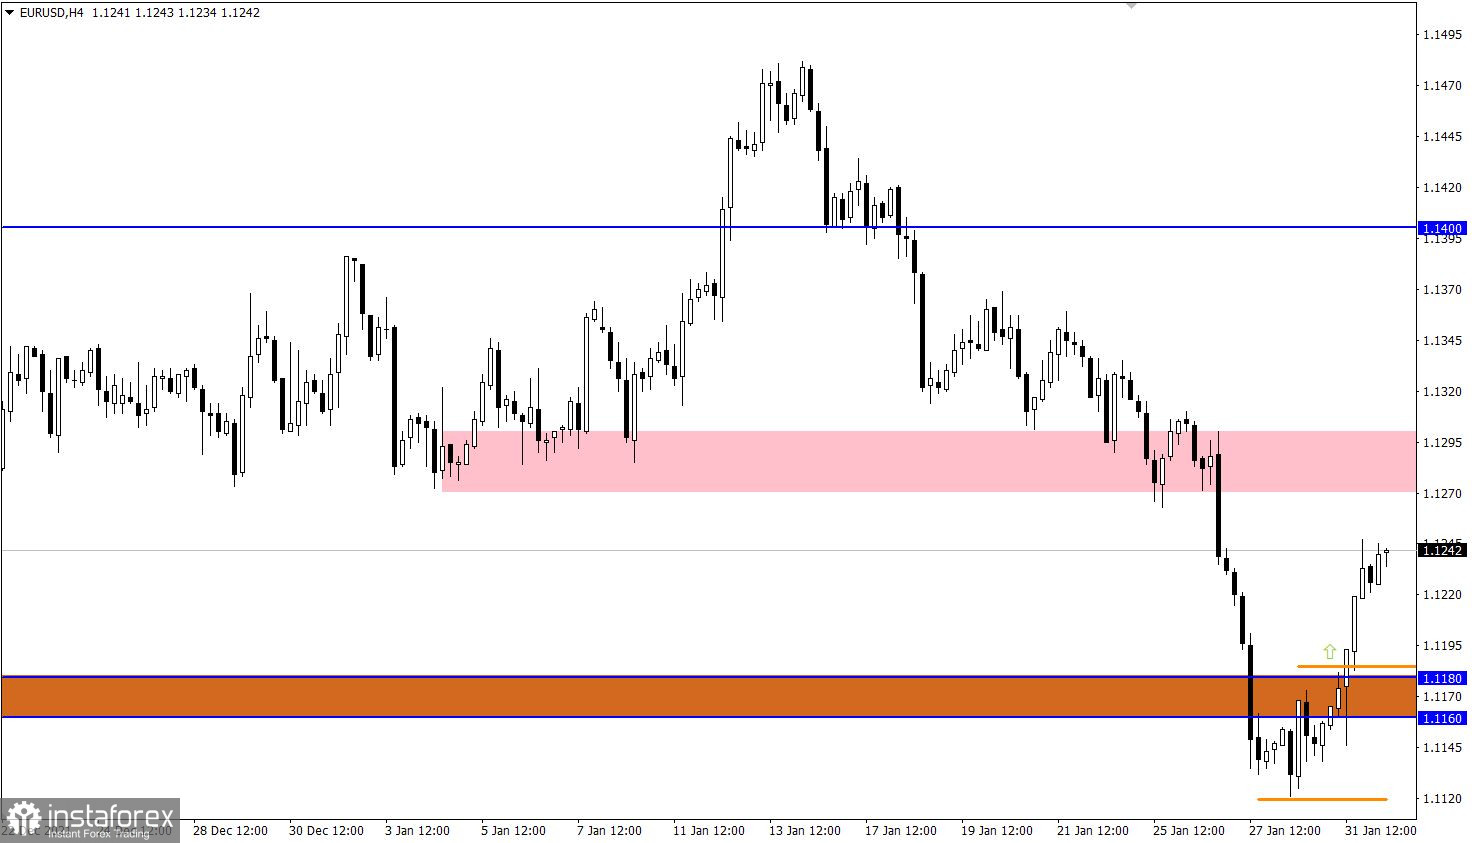
The EUR/USD pair is moving in the correction stage after a sharp decline last week. This move led to the euro's strengthening by about 120 points from a local low of 1.1121.
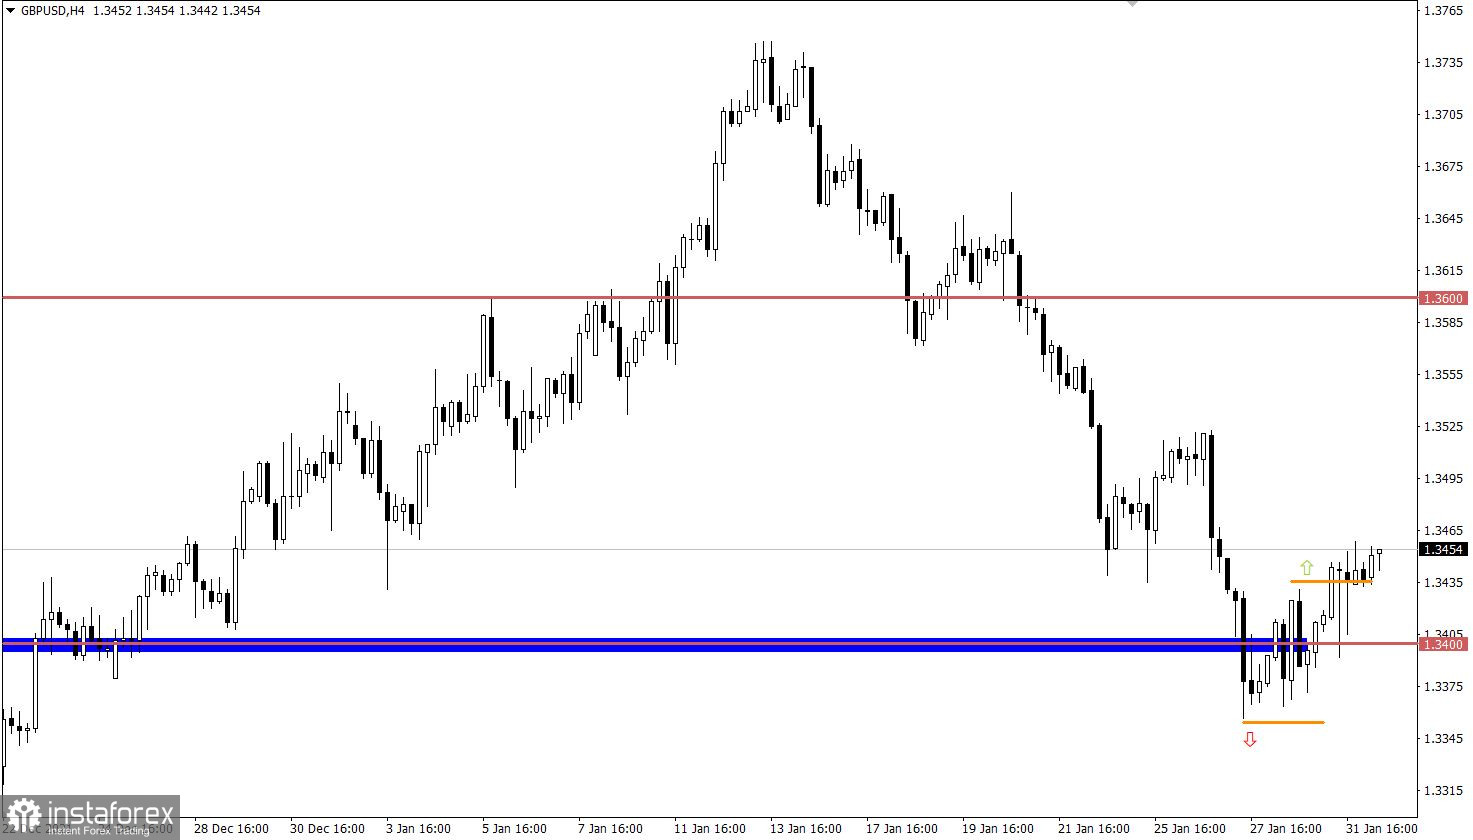
The GBP/USD pair formed a pullback from the local low of 1.3357, as a result of which the quote returned to the area of 1.3450. The realignment of trading forces indicates a temporary slowdown in the downward cycle, but not its end.
There is a gradual recovery of downward interest on the daily timeframe, where the main pivot point is set in the area of 1.3170/1.3200.

February 1 economic calendar:
Europe will release its labor market data today, where the unemployment rate may decline from 7.2% to 7.1%. This is a positive factor that can support the euro locally.
The final data on business activity in the manufacturing sector in Europe, the UK, and the US for January is unlikely to put pressure on the market.
JOLTS data on open vacancies in the US will be published during the American trading session. The total number of which may rise from 10,562 thousand to 11,075 thousand. If the data is confirmed, the US dollar may receive support.
Time targeting
The index of business activity in the European manufacturing sector - 9:00 Universal time
The index of business activity in the UK manufacturing sector - 9:30 Universal time
EU unemployment rate - 10:00 Universal time
The index of business activity in the US manufacturing sector - 14:45 Universal time
The number of open vacancies in the US labor market (JOLTS) - 15:00 Universal time
Trading plan for EUR/USD on Feb 1:
According to the correction structure, the price movement is still relevant in the market, but its scale indicates the possibility of early completion. So while working on the euro's growth, it is worth preparing to reduce the volume of long positions, which will lead to the resumption of the downward trend. The area of 1.1270/1.1300 is considered as a variable resistance level.
Trading plan for GBP/USD on Feb 1:
The pullback stage is still relevant in the market. As a result, traders do not rule out the pound's slight strengthening towards 1.3500. At this moment, a gradual reduction in the volume of long positions is possible, which will eventually lead to the end of the pullback stage and the continuation of the downward cycle.
What is reflected in the trading charts?
A candlestick chart view is graphical rectangles of white and black light, with sticks on top and bottom. When analyzing each candle in detail, you will see its characteristics of a relative period: the opening price, closing price, and maximum and minimum prices.
Horizontal levels are price coordinates, relative to which a stop or a price reversal may occur. These levels are called support and resistance in the market.
Circles and rectangles are highlighted examples where the price of the story unfolded. This color selection indicates horizontal lines that may put pressure on the quote in the future.
The up/down arrows are the reference points of the possible price direction in the future.
*这里的市场分析是为了增加您对市场的了解,而不是给出交易的指示。
InstaSpot分析评论将让您充分了解市场趋势! 作为InstaSpot的客户,您将获得大量的免费服务以实现有效的交易。


