


The legend in the InstaSpot team!
Legend! You think that's bombastic rhetoric? But how should we call a man, who became the first Asian to win the junior world chess championship at 18 and who became the first Indian Grandmaster at 19? That was the start of a hard path to the World Champion title for Viswanathan Anand, the man who became a part of history of chess forever. Now one more legend in the InstaSpot team!


Borussia is one of the most titled football clubs in Germany, which has repeatedly proved to fans: the spirit of competition and leadership will certainly lead to success. Trade in the same way that sports professionals play the game: confidently and actively. Keep a "pass" from Borussia FC and be in the lead with InstaSpot!
The UK's industrial production data were published last Friday, where their volume, considering the revision of the previous period, slowed down from 1.4% ---> 0.2% to 0.1%. The indicators are disappointing, so the pound's decline was reasonable.
During the US trading session, America's retail sales data was published. Their volume fell by 1.8% in December, which is quite a lot. The blow to the US economy didn't end there, as industrial production data, which was expected to rise by 0.4% during the December period, declined by 0.3%.
But despite all this negativity, the value of the US dollar strengthened, which is likely due to a series of sell-offs days earlier.
Analysis of trading charts from January 14:
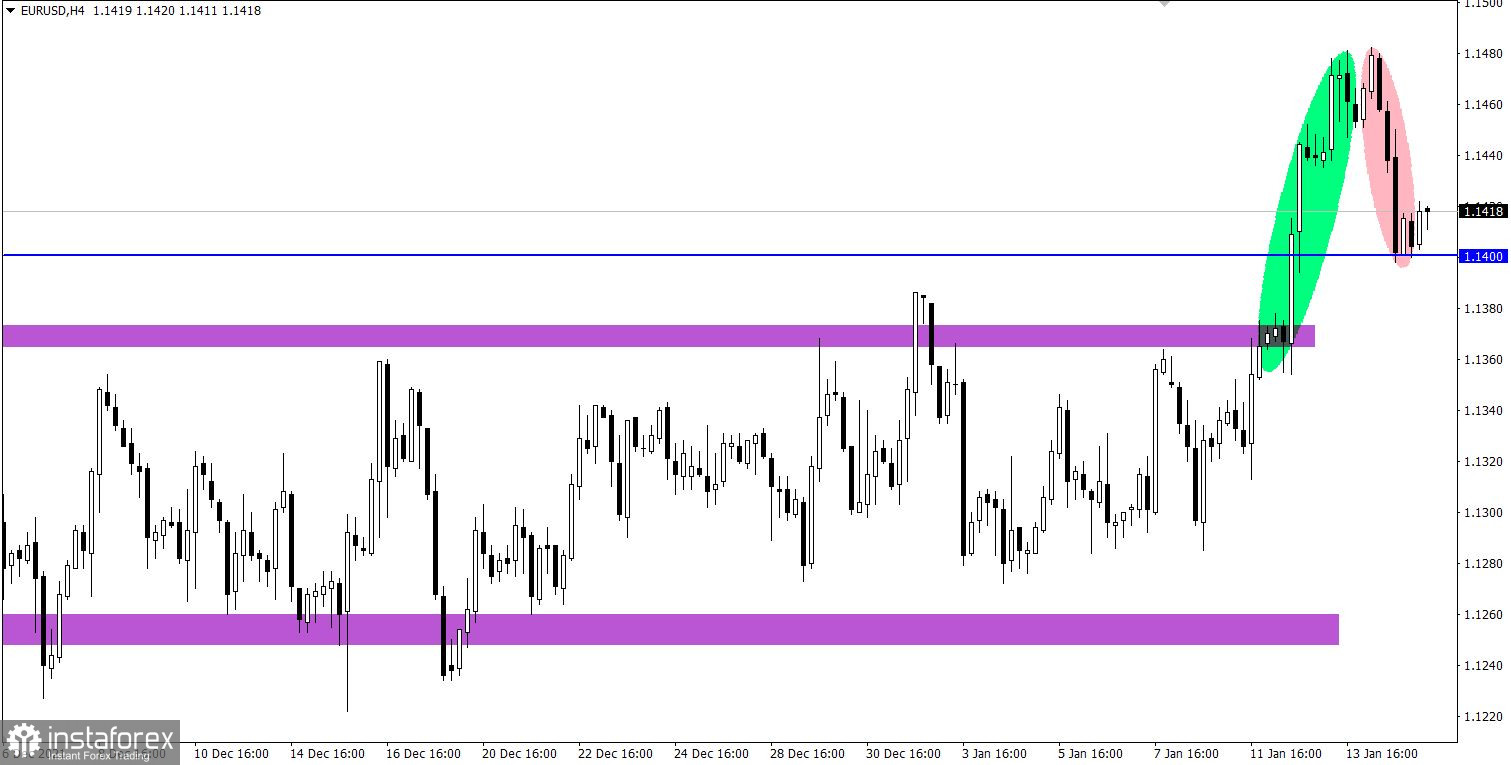
The EUR/USD pair entered the stage of a technical correction after its sharp growth, where the previously broken level of 1.1400 supported sellers.
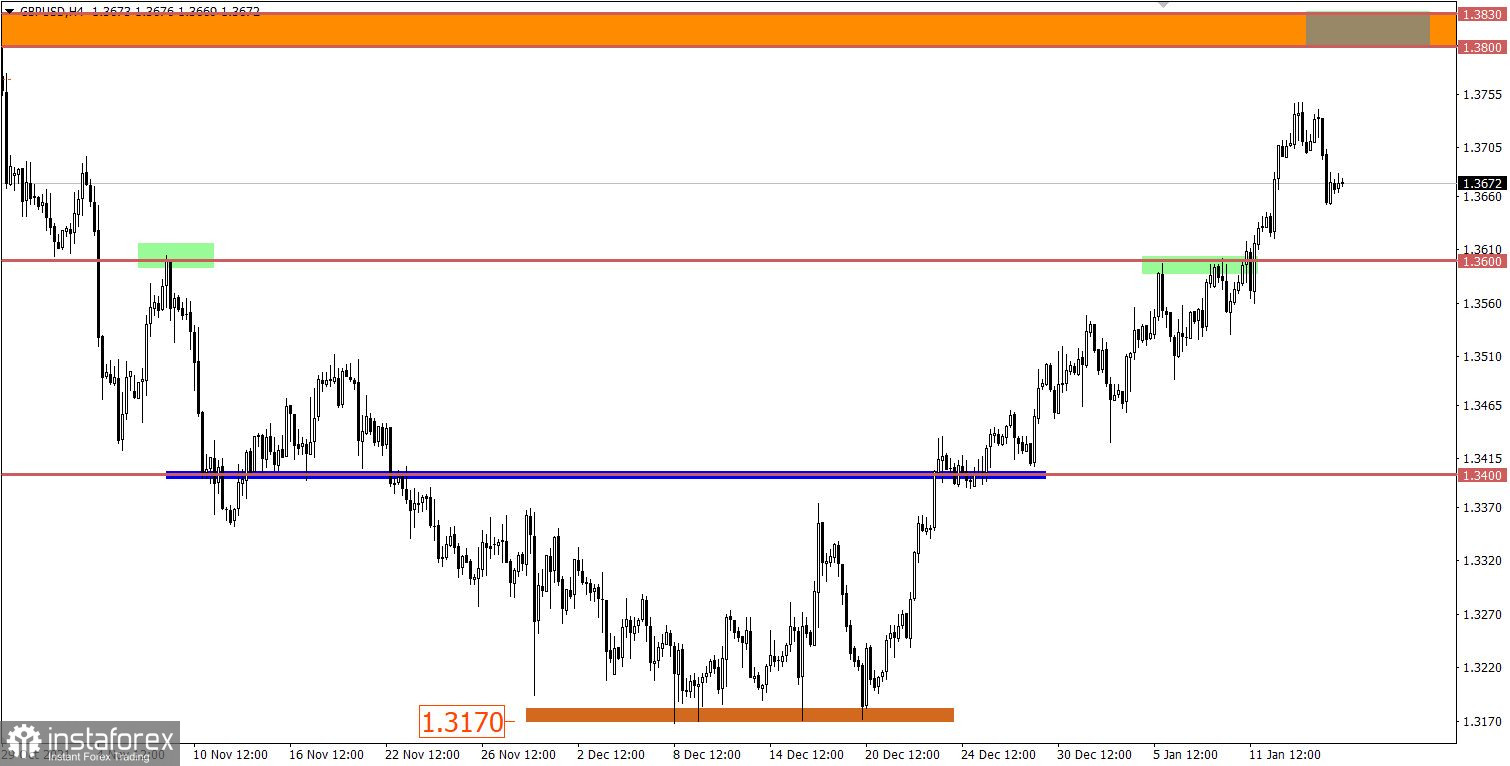
The inertial movement of the GBP/USD pair slowed down the formation in the area of 1.3750, where a stagnation occurred at first, and then a pullback of about 100 points. Given the scale of the upward movement in four weeks, the pound sterling is still overbought by traders.
January 17 economic calendar:
Monday is traditionally accompanied by an empty macroeconomic calendar. In addition to everything, today is a holiday in the United States to celebrate Martin Luther King Day. Therefore, trading volumes will be reduced.
Trading plan for EUR/USD on January 17:
In this situation, much will depend on the level of 1.1400, since holding the price above it may lead to subsequent growth. However, the downward trend is still relevant based on the medium-term prospects, which means that holding the price below the level of 1.1370 in the daily chart will resume the downward cycle in the market.
Trading plan for GBP/USD on January 17:
Despite the pound's overbought status, speculators still keep it at the peak of the inertial course, preventing it from entering the technical correction stage. This can lead to temporary stagnation around the level of 1.3750, with a slight deviation. Traders consider the following values as signal levels: 1.3755 for buying and 1.3645 for selling.
What is reflected in the trading charts?
A candlestick chart view is graphical rectangles of white and black light, with sticks on top and bottom. When analyzing each candle in detail, you will see its characteristics of a relative period: the opening price, closing price, and maximum and minimum prices.
Horizontal levels are price coordinates, relative to which a stop or a price reversal may occur. These levels are called support and resistance in the market.
Circles and rectangles are highlighted examples where the price of the story unfolded. This color selection indicates horizontal lines that may put pressure on the quote in the future.
The up/down arrows are the reference points of the possible price direction in the future.
*这里的市场分析是为了增加您对市场的了解,而不是给出交易的指示。
InstaSpot分析评论将让您充分了解市场趋势! 作为InstaSpot的客户,您将获得大量的免费服务以实现有效的交易。


