


我们的团队有超过700万的操盘手!
我们每天都在一起努力改善交易。我们得到了很高的成绩,并继续前进。
世界各地数以百万计的操盘手的认可是我们工作的最大赞赏! 您做出了您的选择,我们将尽一切努力来满足您的期望!
我们是一个共同的伟大团队!
InstaSpot. 自豪地为您工作!


Here are the details of the economic calendar on January 10, 2021:
The Eurozone's unemployment rate declined from 7.3% to 7.2%, which is a positive signal for the recovery of the labor market, however, it is still significantly higher compared to the United States. Despite the positive data, the currency markets simply ignored them.
Analysis of trading charts from January 10:
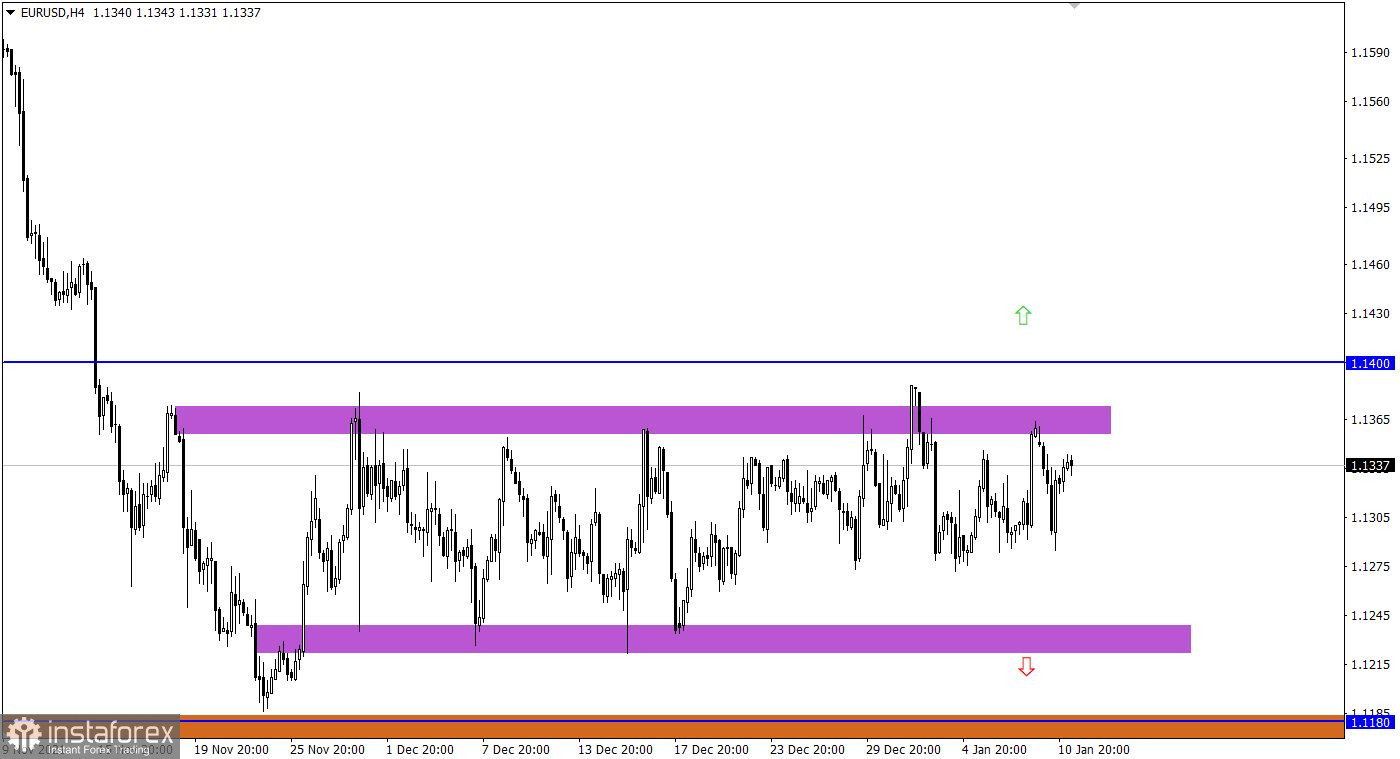
The price increases for the EUR/USD pair are still within the 1.1225/1.1355 side channel. Such a long stay in a closed range attracts the abundant attention of speculators. This process will lead to sharp price changes sooner or later, which should be prepared for now.
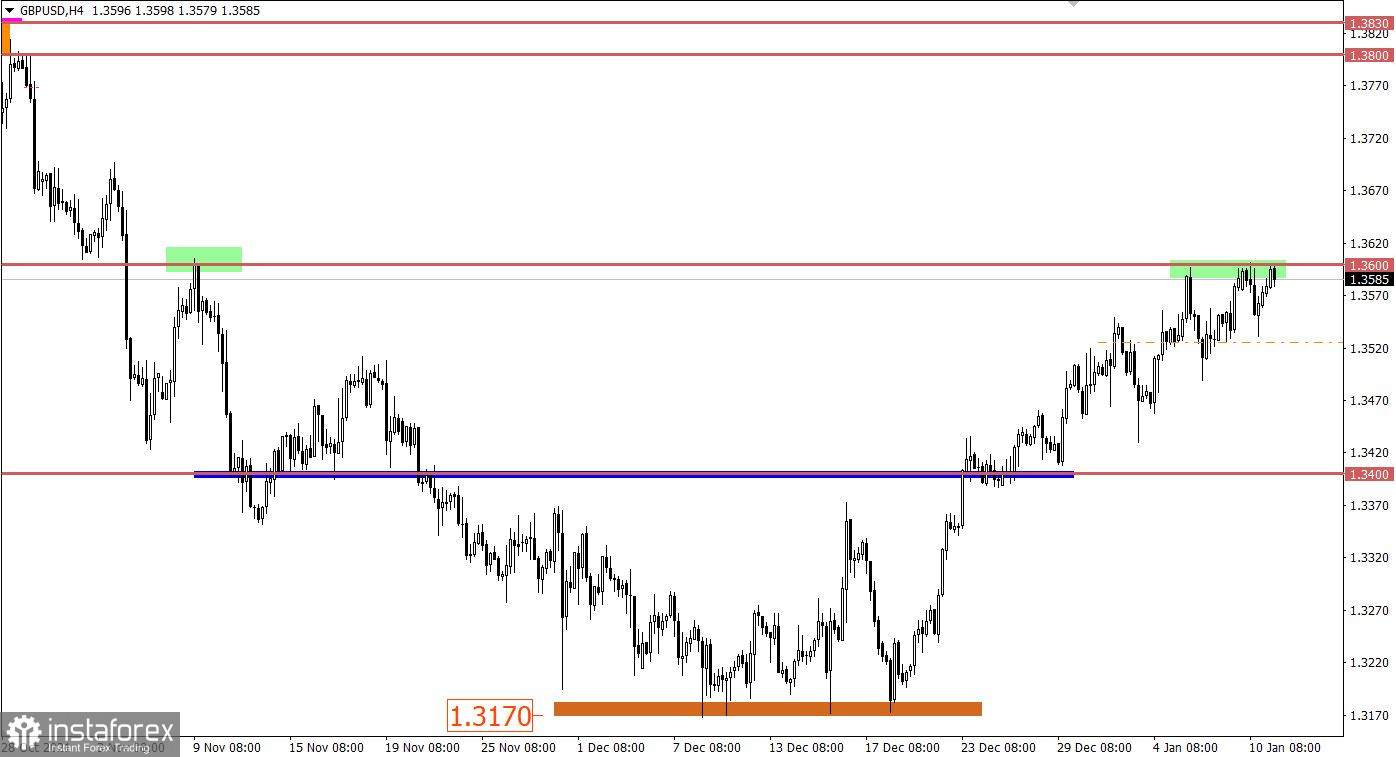
The GBP/USD pair is moving within the resistance level of 1.3600, where the reduction in the volume of long positions was previously observed. This led to a slowdown in the upward cycle and, as a result, to stagnation.

January 11 economic calendar:
There is nothing on the economic calendar today in terms of statistics, but a number of speeches from the ECB and the Fed are scheduled. Speculators will closely monitor Lagarde and Powell's words, as this is the only leverage for speculation.
Time targeting
ECB President Lagarde will deliver a speech - 10:20 Universal time
FOMC member Mester's speech - 14:00 Universal time
FOMC Member George's speech - 14:30 Universal time
Fed Chairman Powell's speech - 15:00 Universal time
Trading plan for EUR/USD on January 11:
In this situation, the tactics of trading on a rebound from the set boundaries of the flat are still relevant, but the breakdown method is considered the main strategy. Therefore, traders are already considering the control levels of 1.1220 and 1.1400 as signal levels, relative to which they will perform the main actions in the market.
Trading plan for GBP/USD on January 11:
The resistance level of 1.3600 is still putting pressure on buyers, which may lead to the subsequent formation of amplitude within the borders of 1.3530/1.3600.
The signal for action will be the price retention beyond one or another border of the established stagnation.
Buy positions should be considered after holding the price above the level of 1.3620 in a four-hour period.
Sell positions should be considered after holding the price below the level of 1.3520 in a four-hour period.
What is reflected in the trading charts?
A candlestick chart view is graphical rectangles of white and black light, with sticks on top and bottom. When analyzing each candle in detail, you will see its characteristics of a relative period: the opening price, closing price, and maximum and minimum prices.
Horizontal levels are price coordinates, relative to which a stop or a price reversal may occur. These levels are called support and resistance in the market.
Circles and rectangles are highlighted examples where the price of the story unfolded. This color selection indicates horizontal lines that may put pressure on the quote in the future.
The up/down arrows are the reference points of the possible price direction in the future.
*这里的市场分析是为了增加您对市场的了解,而不是给出交易的指示。
InstaSpot分析评论将让您充分了解市场趋势! 作为InstaSpot的客户,您将获得大量的免费服务以实现有效的交易。


