


我们的团队有超过700万的操盘手!
我们每天都在一起努力改善交易。我们得到了很高的成绩,并继续前进。
世界各地数以百万计的操盘手的认可是我们工作的最大赞赏! 您做出了您的选择,我们将尽一切努力来满足您的期望!
我们是一个共同的伟大团队!
InstaSpot. 自豪地为您工作!


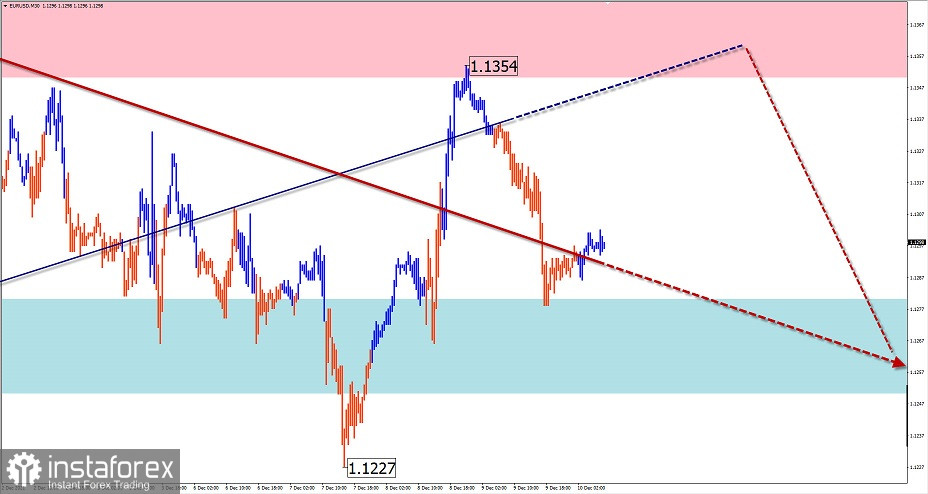
EUR/USD
Analysis:
Earlier this year, a downward wave zigzag began on the euro chart. Quotes have reached a cluster of different scale zones. Since the middle of last month, the price has been moving sideways, forming an intermediate-term correction.
Outlook:
The pair's current flat mood is expected to continue in the coming day. Most likely, the price will move within the counter-zone bounded price corridor. In the first half of the day, an upward vector can be expected.
Potential reversal zones
Resistance:
- 1.1350/1.1380
Support:
- 1.1280/1.1250
Recommendations:
Euro market trades today can only be profitable within individual trading sessions. It is advisable to reduce the lot size to minimize the risk. Selling will be possible after the occurrence of unambiguous signals of a reversal in the area of calculated resistance.
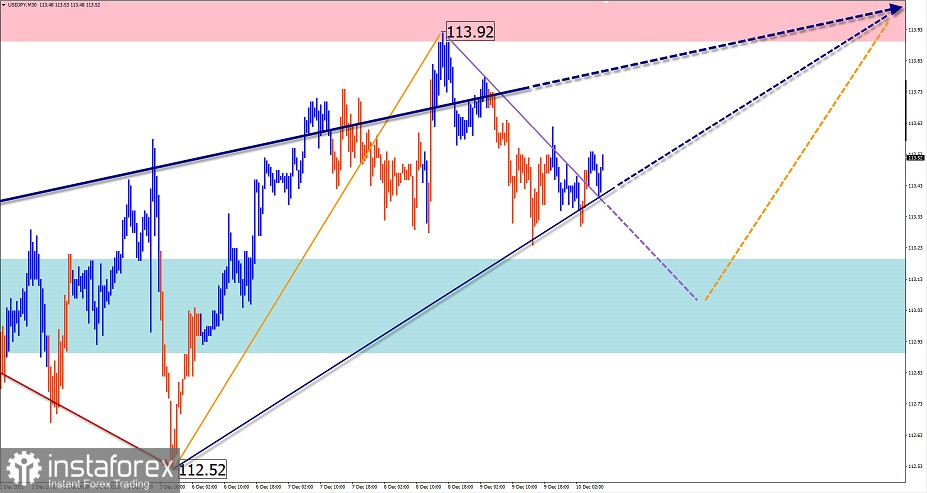
USD/JPY
Analysis:
The overall dominant direction of the Japanese Yen since January this year is set by an ascending wave algorithm. After reaching the potential reversal zone since October 15, the price went into the sideways drift, forming a stretched plane. The structure of this wave looks complete. The uptrend from November 30 could be the start of a reversal structure before another short-term reversal.
Outlook:
A continuation of the general sideways movement vector is expected today. During the European session, the pressure on the support area is likely, followed by the reversal and growth of the price to the resistance area.
Potential reversal zones
Resistance:
- 113.90/114.20
Support:
- 113.20/111.90
Recommendations:
Trading in the Japanese yen market today is possible in the intraday small lot. Buying from the support area is more promising.
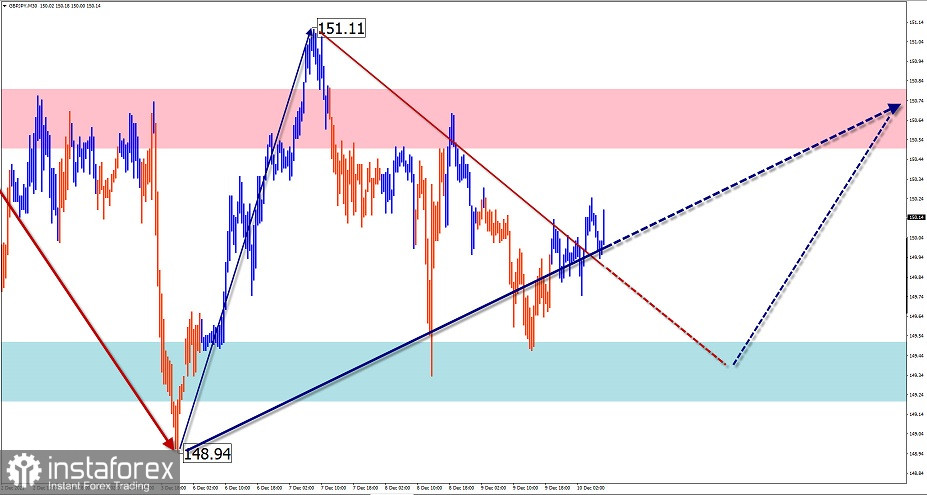
GBP/JPY
Analysis:
An extended bullish trend in the Pound/Yen cross has shifted the pair's quotations to a strong resistance zone. The price has been correcting downwards from this zone for a month and a half. The values reached the support zone. The uptrend that started on December 3 has no reversal potential at the time of analysis.
Outlook:
Over the next 24 hours, the price is expected to move in a sideways price corridor between the counter zones. During the European session, a downward vector is more likely. Change of the vector and the subsequent rise in the rate can be expected at the end of the day or tomorrow.
Potential reversal zones
Resistance:
- 150.50/150.80
Support:
- 149.50/149.20
Recommendations:
Trading with no trend is riskier and may be loss-making. Short-term trades are possible today according to the expected sequence. It is recommended to reduce the trading lot as much as possible.
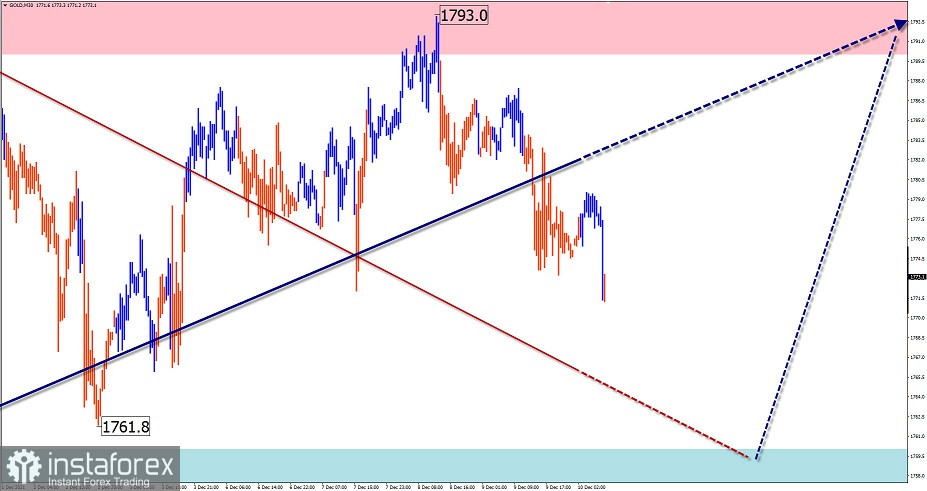
GOLD
Analysis:
The incomplete upward wave structure on the gold chart so far most closely resembles a shifting plane. A month ago, it began a downward section in its structure, which is still incomplete. During the last decade, the quotations are moving mainly sideways, forming a pullback.
Outlook:
Price is expected to move in a flat price corridor over the next 24 hours. After a possible pressure attempt on the support zone in the first half of the day, we can expect a change of course and a rise in the price to the resistance area.
Potential reversal zones
Resistance:
- 1790.0/1795.0
Support:
- 1760.0/1755.0
Recommendations:
Excessive trading activity in the gold market today could lead to deposit losses. It is recommended to refrain from trading until there are clear buy signals around the support zone.
Explanation: In simplified wave analysis (SVA), waves consist of 3 parts (A-B-C). The last unfinished wave is analysed. The solid arrow background shows the structure formed. The dotted arrow shows the expected movements.
Attention: The wave algorithm does not take into account the duration of the instrument movements over time!
*这里的市场分析是为了增加您对市场的了解,而不是给出交易的指示。
InstaSpot分析评论将让您充分了解市场趋势! 作为InstaSpot的客户,您将获得大量的免费服务以实现有效的交易。


