


我们的团队有超过700万的操盘手!
我们每天都在一起努力改善交易。我们得到了很高的成绩,并继续前进。
世界各地数以百万计的操盘手的认可是我们工作的最大赞赏! 您做出了您的选择,我们将尽一切努力来满足您的期望!
我们是一个共同的伟大团队!
InstaSpot. 自豪地为您工作!


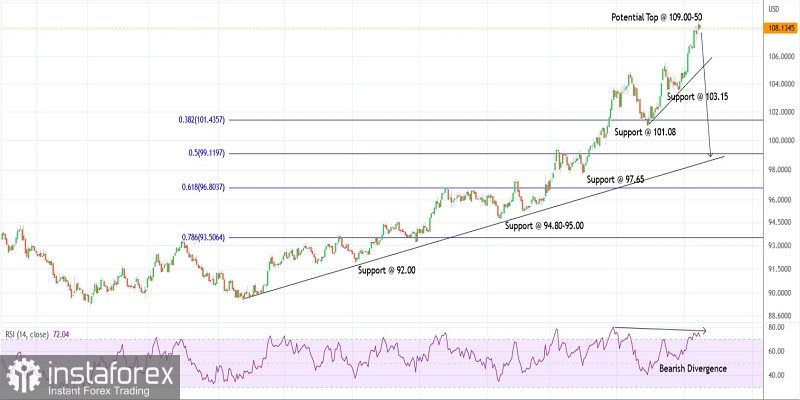
The US dollar index continued to defy resistance and topped the 109.00 level on Thursday before easing off. The index is seen to be trading below 108.00 and potential remains for a drag towards the 107.00-10 initial support in the near term. It could be the first step towards a larger-degree bearish reversal towards 101.00.
The US dollar index has risen meticulously since January 06, 2021, printing the 89.20 low as seen on the daily chart. It has produced a religious rally between 89.20 and 109.00, carving higher highs and higher lows and might have already terminated its rise. Ideally, the entire rally should be retraced and prices should drop towards 97.00 in the next several weeks.
The US dollar index bears are now poised to come back in control and hold prices below the 109.00 interim resistance. Also, note that a potential shooting star candlestick pattern was complete on the daily chart indicating a potential reversal ahead. The initial support is seen at around 103.15, followed by 101.00 which could be potential targets.
The US dollar index has been printing recent highs accompanied by a strong bearish divergence on the daily RSI as seen here. The recent high at 109.00 has seen the RSI dropping, indicating a potential trend reversal ahead. Bears might be preparing to come back strong enough from the current levels and drag the price towards 101.00 at least, which is the Fibonacci 0.382 retracement of the entire rally.
Potential drop towards 101.00 against 109.00
Good luck!
*这里的市场分析是为了增加您对市场的了解,而不是给出交易的指示。
InstaSpot分析评论将让您充分了解市场趋势! 作为InstaSpot的客户,您将获得大量的免费服务以实现有效的交易。


