


我们的团队有超过700万的操盘手!
我们每天都在一起努力改善交易。我们得到了很高的成绩,并继续前进。
世界各地数以百万计的操盘手的认可是我们工作的最大赞赏! 您做出了您的选择,我们将尽一切努力来满足您的期望!
我们是一个共同的伟大团队!
InstaSpot. 自豪地为您工作!


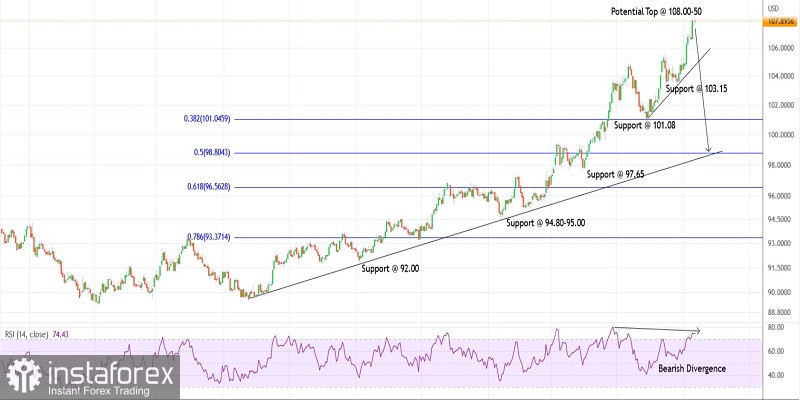
The US dollar index climbed towards 108.30 on Tuesday before reversing sharply lower to 107.53 intraday. The index oscillated within the 80-pips range producing a Doji candlestick pattern on the daily chart. A high probability remains for a bearish Evening Star candlestick pattern indicating a potential trend reversal. We will be able to recognize it according to further price action.
The US dollar index has remained in control of bulls since January 06, 2021, after printing lows at around 89.20. The index has remained in a religious uptrend thereafter, carving a series of higher highs and higher lows towards 108.30 recently. The entire rally seems complete or close to complete. Hence, a probability remains for a meaningful corrective drop to unfold going forward.
The US dollar index is looking to drag lower towards the 101.00 support, which is also the Fibonacci 0.382 retracement of the entire rally between 89.20 and 108.30. A break below 103.15 will be encouraging for bears and could be the first step towards a larger correction. Also, note that prices could drop towards the Fibonacci 0.618 retracement that matches the 95.00-96.00 zone.
The US dollar index has potentially terminated a larger-degree upswing towards 108.30. Furthermore, recent highs have been accompanied by a bearish divergence on the daily RSI. This could be viewed as a strong indicator of a potential trend reversal towards 101.00 at least. The bottom line for the above is that prices should stay below 108.30.
Potential drop towards 101.00 against 108.50
Good luck!
*这里的市场分析是为了增加您对市场的了解,而不是给出交易的指示。
InstaSpot分析评论将让您充分了解市场趋势! 作为InstaSpot的客户,您将获得大量的免费服务以实现有效的交易。


