


The legend in the InstaSpot team!
Legend! You think that's bombastic rhetoric? But how should we call a man, who became the first Asian to win the junior world chess championship at 18 and who became the first Indian Grandmaster at 19? That was the start of a hard path to the World Champion title for Viswanathan Anand, the man who became a part of history of chess forever. Now one more legend in the InstaSpot team!


Borussia is one of the most titled football clubs in Germany, which has repeatedly proved to fans: the spirit of competition and leadership will certainly lead to success. Trade in the same way that sports professionals play the game: confidently and actively. Keep a "pass" from Borussia FC and be in the lead with InstaSpot!
GBPUSD dropped to fresh swing lows around 1.1875 intraday on Wednesday before pulling back higher. It has produced a Star Doji candlestick pattern on the daily chart indicating a potential bullish reversal ahead. The currency pair is trading at near 1.1960 at this point in writing. A close above 1.2040-50 on Thursday will confirm a Morning Star candlestick pattern.
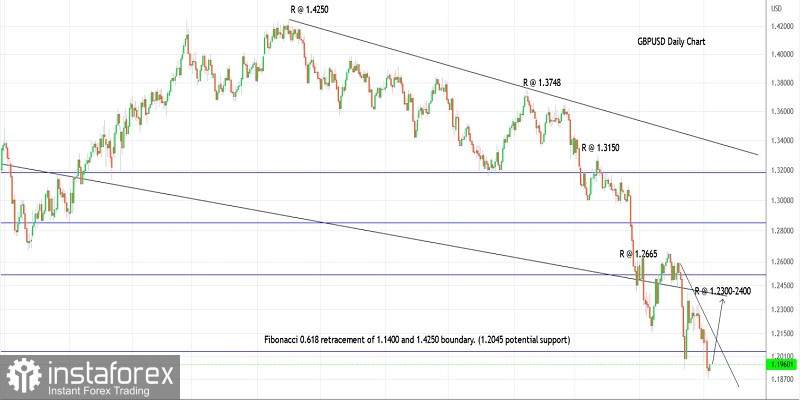
GBPUSD has already completed its larger-degree corrective drop, which began from 1.4250 highs in January 2021. The drop unfolded as a double zigzag pattern and might have already terminated at 1.1875 on Wednesday. Also, note that prices are finding support from just below the Fibonacci 0.618 retracement of the larger-degree upswing between 1.1400 and 1.4250 as marked on the chart.
A high probability remains for a bullish reversal if the suggested structure remains intact. Immediate price resistance is seen in the 1.2300-2400 zone. A break higher will confirm that bulls are back in control and are here to stay for long. On the flip side, if prices break below 1.1875, the currency pair could further decline towards 1.1800 before finding support again.
Looking at the 1-hour chart, GBPUSD might print a shallow low below 1.1875 to complete its drop, which began from the 1.2165 highs earlier. Alternatively, if bulls are able to push prices above the 1.1990 interim resistance, it would confirm that bulls are back in control and prices will push further towards the 1.2165-70 resistance.
Potential rally towards 1.2665 against 1.1800
Good luck!
*这里的市场分析是为了增加您对市场的了解,而不是给出交易的指示。
InstaSpot分析评论将让您充分了解市场趋势! 作为InstaSpot的客户,您将获得大量的免费服务以实现有效的交易。


