


The legend in the InstaSpot team!
Legend! You think that's bombastic rhetoric? But how should we call a man, who became the first Asian to win the junior world chess championship at 18 and who became the first Indian Grandmaster at 19? That was the start of a hard path to the World Champion title for Viswanathan Anand, the man who became a part of history of chess forever. Now one more legend in the InstaSpot team!


Borussia is one of the most titled football clubs in Germany, which has repeatedly proved to fans: the spirit of competition and leadership will certainly lead to success. Trade in the same way that sports professionals play the game: confidently and actively. Keep a "pass" from Borussia FC and be in the lead with InstaSpot!
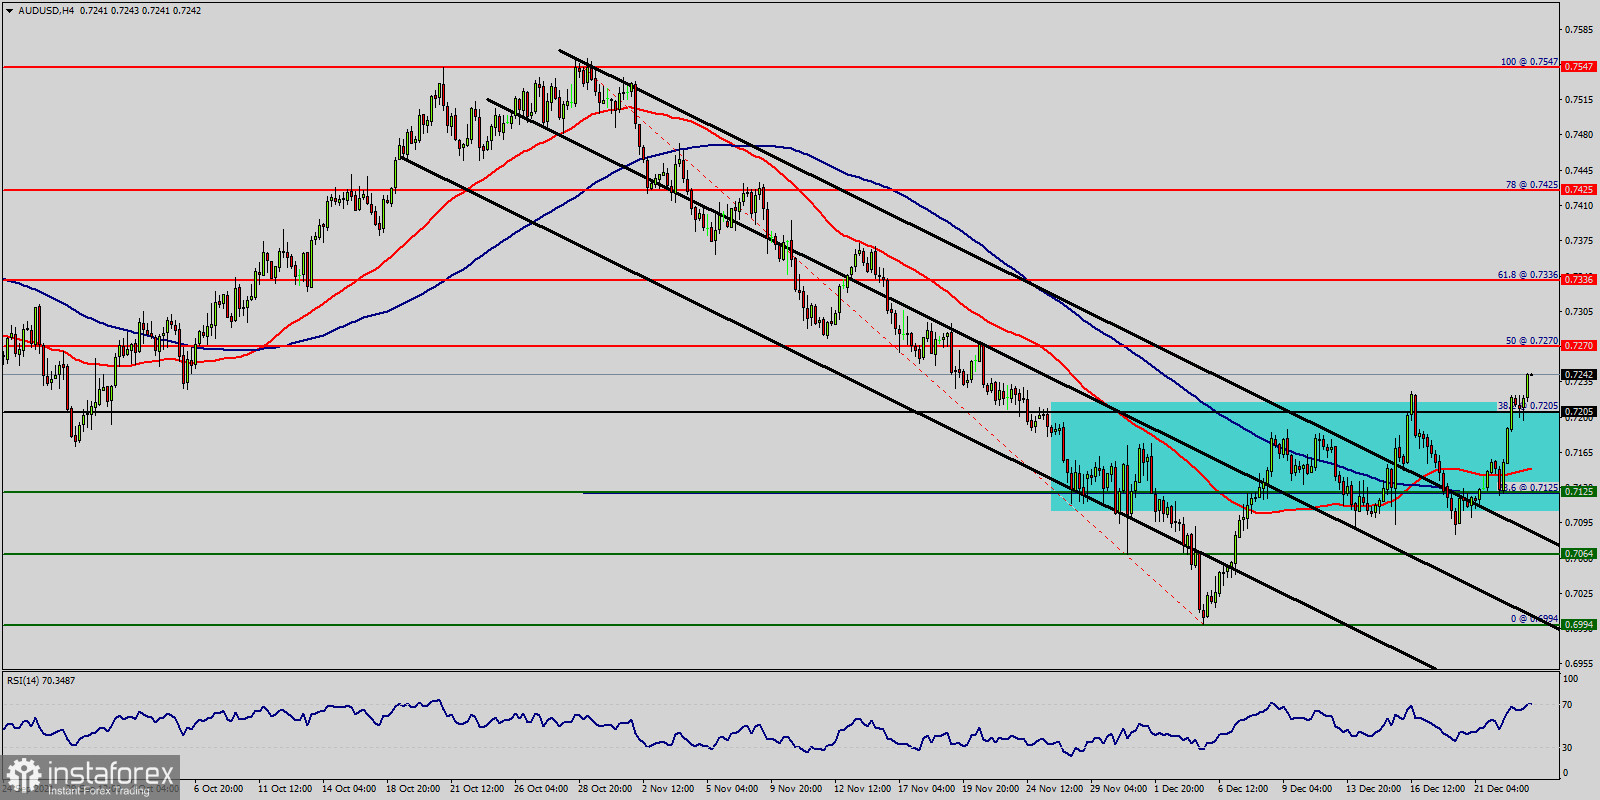
The AUD/USD pair will continue rising from the level of 0.7205 in the long term. It should be noted that the support is established at the level of 0.7125 which represents the daily pivot point on the H1 chart.
The Relative Strength Index on the four-hour chart is just above 65 – indicating overbought levels. However, momentum remains to the upside and the currency pair is holding above the 50 and 100 Simple Moving Averages.
The RSI is still signaling that the trend is upward as it remains strong above the moving average (100). This suggests that the pair will probably go up in coming hours. All in all, there is a chance that AUD/USD disregards overbought conditions for some time. Accordingly, the AUD/USD pair is showing signs of strength following a breakout of the highest level of 0.7270.
The pair rose from the level of 0.7205 (weekly support) to the top around 0.7336. Today, the first support level is seen at 0.7270 followed by 0.7336, while daily resistance is seen at 0.7270.
So, buy above the level of 0.7205 with the first target at 0.7270 in order to test the daily resistance 1. If the trend breaks the second resistance level of 0.7270, the pair is likely to move upwards continuing the bullish trend development to the level 0.7336.
The level of 0.7336 is a good place to take profits. Moreover, On the downtrend: If the pair fails to pass through the level of 0.7336, the market will indicate a bearish opportunity below the level of 0.7336. The market will decline further to 0.7125 and 0.7064 to return to the daily support. Moreover, a breakout of that target will move the pair further downwards to 0.6994 in order to form the double bottom.
*这里的市场分析是为了增加您对市场的了解,而不是给出交易的指示。
InstaSpot分析评论将让您充分了解市场趋势! 作为InstaSpot的客户,您将获得大量的免费服务以实现有效的交易。


