


我们的团队有超过700万的操盘手!
我们每天都在一起努力改善交易。我们得到了很高的成绩,并继续前进。
世界各地数以百万计的操盘手的认可是我们工作的最大赞赏! 您做出了您的选择,我们将尽一切努力来满足您的期望!
我们是一个共同的伟大团队!
InstaSpot. 自豪地为您工作!


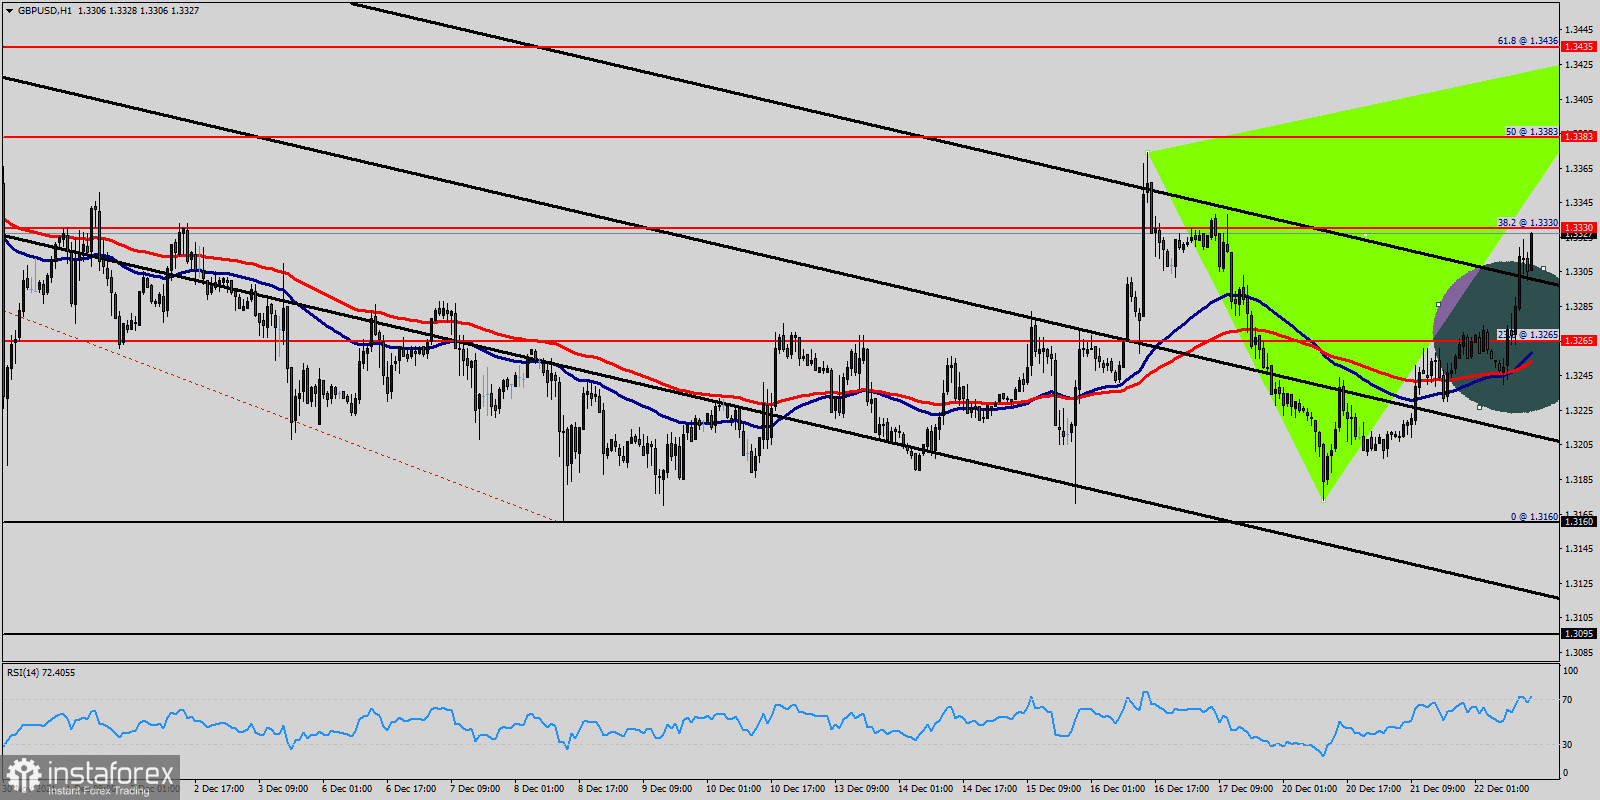
The USD/GBP pair continues to move upwards from the level of 1.3265. Today, the first support level is currently seen at 1.3265, the price is moving in a bullish channel now. The USD/GBP's pair support has found at the level of 1.3265 providing a clear signal to buy with a target seen at 1.3383.
If the trend breaks the minor resistance at 1.3330, the pair will move upwards continuing the bullish trend development to the level 1.3383 in order to test the daily resistance 2, last bullish wave, highs.
The USD/GBP pair is showing signs of strength following a breakout of the highest level of 1.3383. On the H1 chart. the level of 1.3265 coincides with 23.6 % of Fibonacci, which is expected to act as minor support today.
Since the trend is above the 23.6 % Fibonacci level, the market is still in an uptrend. But, major support is seen at the level of 1.3265. This is confirmed by the RSI indicator signaling that we are still in the bullish trending market.
Now, the pair is likely to begin an ascending movement to the point of 13265 and further to the levesl of 1.3330, 1.3383 and 1.3435. Furthermore, the trend is still showing strength above the moving average (100).
Thus, the market is indicating a bullish opportunity above the above-mentioned support levels, for that the bullish outlook remains the same as long as the 100 EMA is headed to the upside. It should be noted that volatility is very high for that the USD/GBP pair is still moving between 1.3160 and 1.3435 in coming hours.
*这里的市场分析是为了增加您对市场的了解,而不是给出交易的指示。
InstaSpot分析评论将让您充分了解市场趋势! 作为InstaSpot的客户,您将获得大量的免费服务以实现有效的交易。


