


The legend in the InstaSpot team!
Legend! You think that's bombastic rhetoric? But how should we call a man, who became the first Asian to win the junior world chess championship at 18 and who became the first Indian Grandmaster at 19? That was the start of a hard path to the World Champion title for Viswanathan Anand, the man who became a part of history of chess forever. Now one more legend in the InstaSpot team!


Borussia is one of the most titled football clubs in Germany, which has repeatedly proved to fans: the spirit of competition and leadership will certainly lead to success. Trade in the same way that sports professionals play the game: confidently and actively. Keep a "pass" from Borussia FC and be in the lead with InstaSpot!
In previous posts we warned Gold bears that price had all the technical justifications for a reversal and we also added the bullish signal by the Ichimoku cloud indicator. Gold price is now trading around $1,810 having retraced nearly 50% of the decline from $1,876.
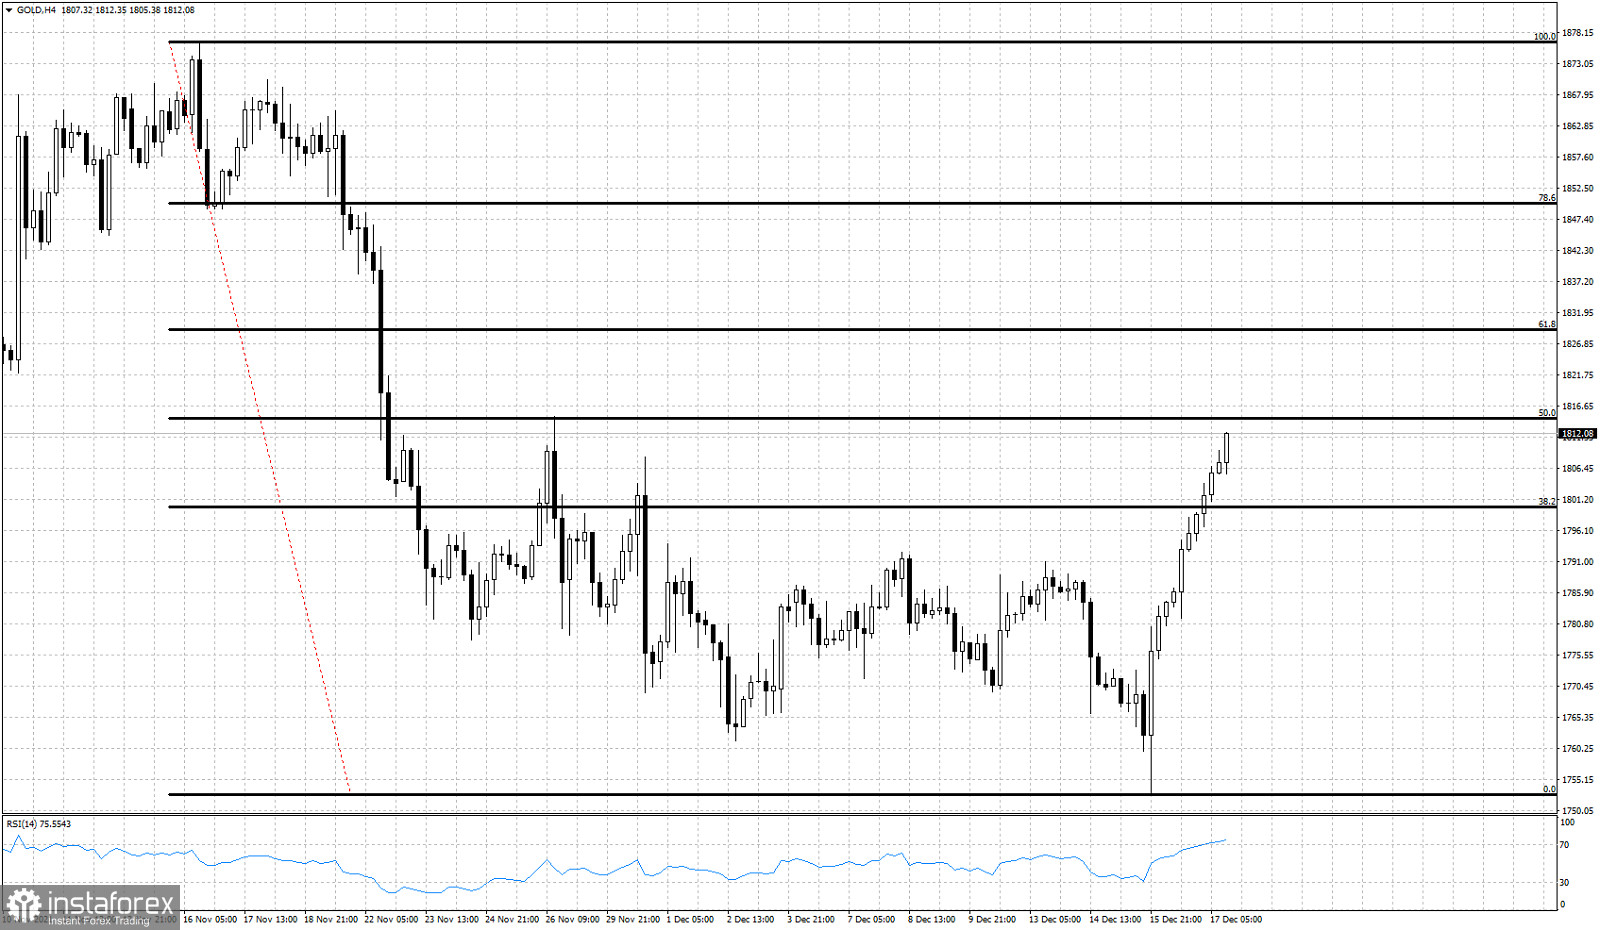
Gold price easily broke above the 38% Fibonacci retracement. Short-term trend is bullish as price is making a sharp move higher with no looking back. Next important resistance level is at the 61.8% retracement level at $1,829. Since Gold price has not made any pull back since the $1,752 low from December 15th, I would not be surprised to see Gold pull back and test the 38% retracement from above.
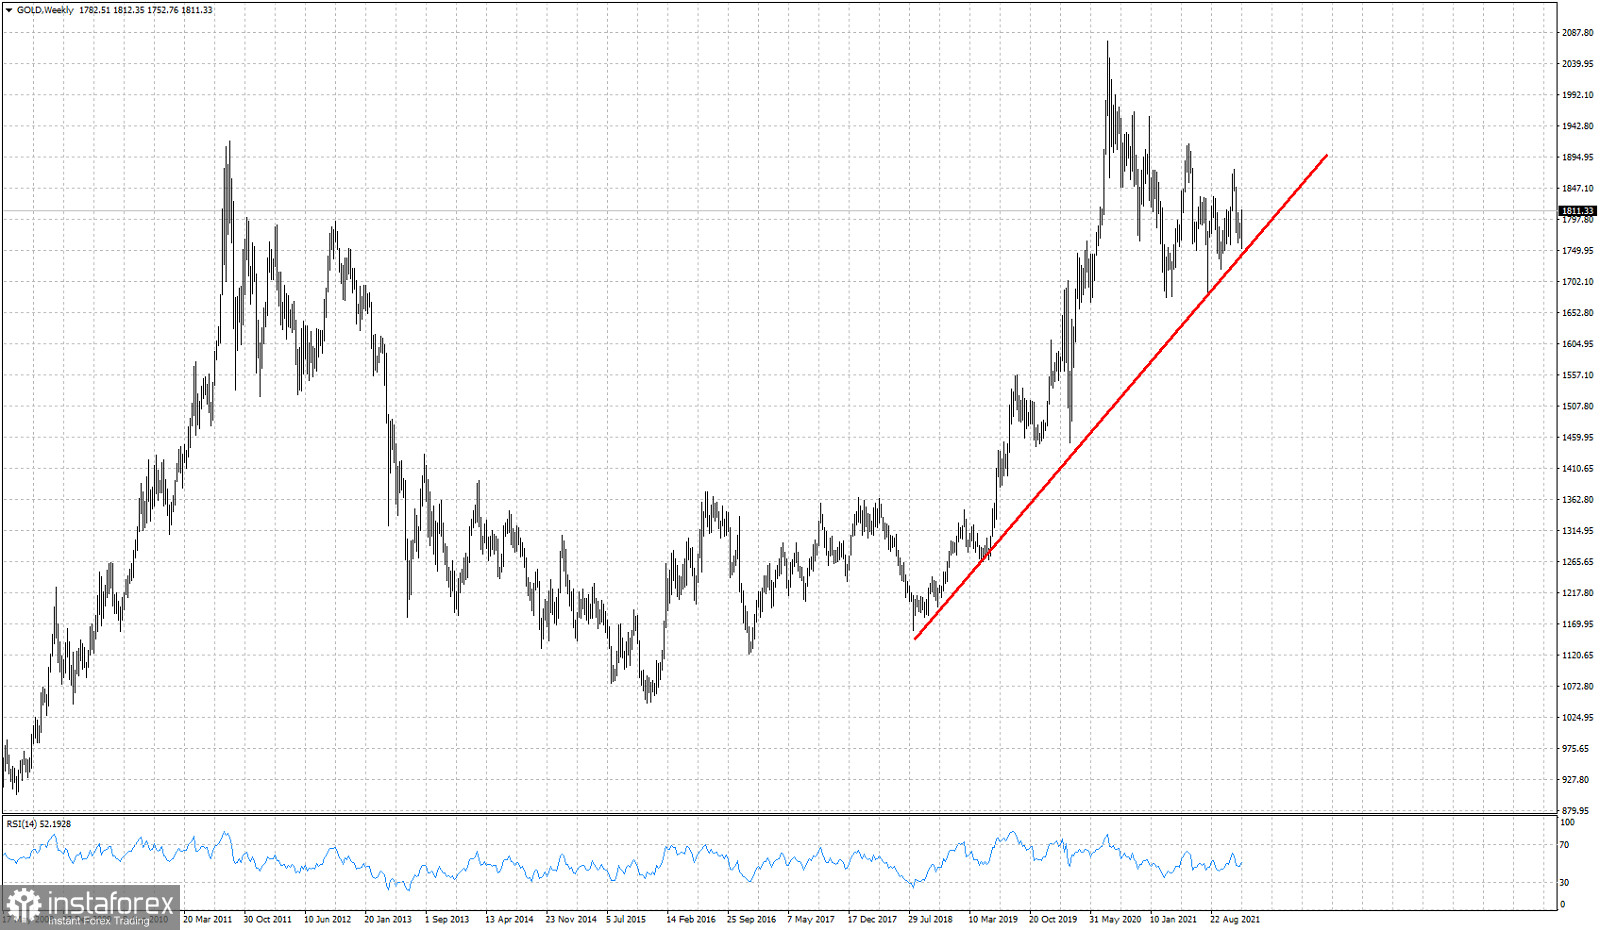
On a weekly basis Gold price continues to respect the red upward sloping trend line. Price nearly touched the trend line this week. Bouncing off the trend line is a bullish sign. This increases the importance of the recent low at $1,750 area. Any break below this level will be an important bearish signal that could lead price towards $1,400-$1,500.
*这里的市场分析是为了增加您对市场的了解,而不是给出交易的指示。
InstaSpot分析评论将让您充分了解市场趋势! 作为InstaSpot的客户,您将获得大量的免费服务以实现有效的交易。


