


The legend in the InstaSpot team!
Legend! You think that's bombastic rhetoric? But how should we call a man, who became the first Asian to win the junior world chess championship at 18 and who became the first Indian Grandmaster at 19? That was the start of a hard path to the World Champion title for Viswanathan Anand, the man who became a part of history of chess forever. Now one more legend in the InstaSpot team!


Borussia is one of the most titled football clubs in Germany, which has repeatedly proved to fans: the spirit of competition and leadership will certainly lead to success. Trade in the same way that sports professionals play the game: confidently and actively. Keep a "pass" from Borussia FC and be in the lead with InstaSpot!
Ethereum is trading at 4,293.88 level and it seems undecided as the price action developed a triangle pattern. It remains to see if the chart formation will be a reversal or a continuation pattern. In the short term, the rate could move sideways trying to attract more bullish energy.
Technically, the crypto signaled that the downside movement is over and that the buyers could take the lead again. Still, we'll have to wait for confirmation before taking action. ETH/USD is up by 0.76%% in the last 7-days and is down by 0.13% in the last 24 hours.
Bitcoin moves sideways as well, so only BTC/USD's rally could force the price of Ethereum to climb higher. Still, Bitcoin could come down to test and retest a support zone before trying to rebound.
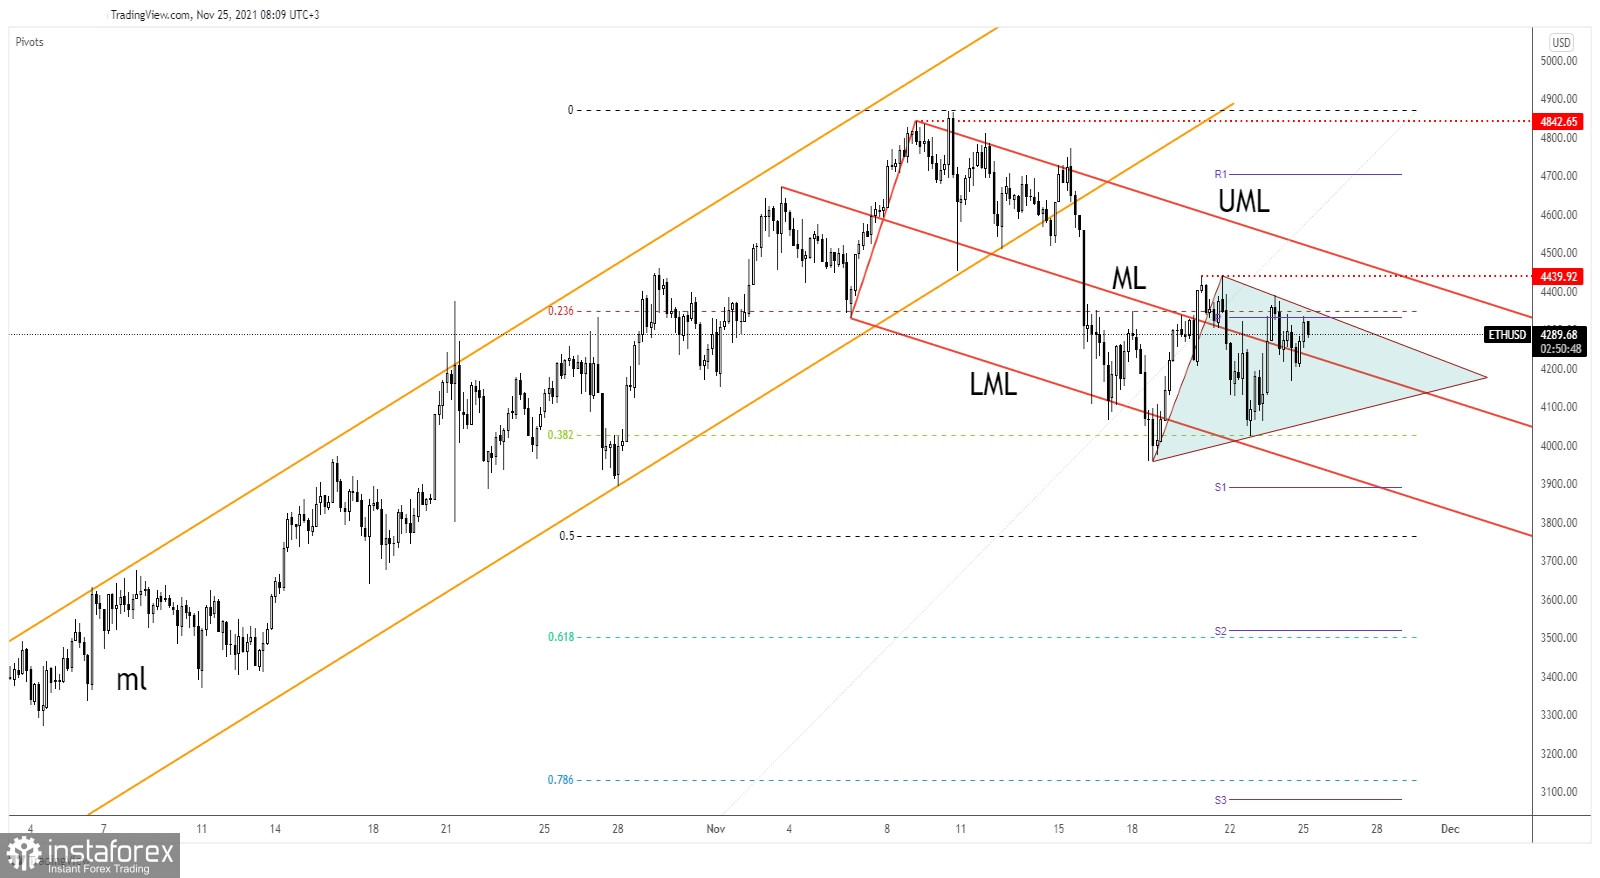
ETH/USD is traded above the descending pitchfork's median line (ML) but the 23.6% retracement level and the weekly pivot point (4,331.09) stopped the upside movement. It has developed a triangle pattern, an upside breakout from this formation could signal potential further growth.
As you can see, the crypto has found support on the 38.2% retracement level signaling that the downside movement is over.
Ethereum could resume its uptrend only if it jumps and closes above the 4,439.92 and above the descending pitchfork's upper median line (UML). It could try to take out the near-term resistance levels as long as it stays above the median line (ML) or above 38.2% (4,024.81).
*这里的市场分析是为了增加您对市场的了解,而不是给出交易的指示。
InstaSpot分析评论将让您充分了解市场趋势! 作为InstaSpot的客户,您将获得大量的免费服务以实现有效的交易。


