


Borussia is one of the most titled football clubs in Germany, which has repeatedly proved to fans: the spirit of competition and leadership will certainly lead to success. Trade in the same way that sports professionals play the game: confidently and actively. Keep a "pass" from Borussia FC and be in the lead with InstaSpot!


我们的团队有超过700万的操盘手!
我们每天都在一起努力改善交易。我们得到了很高的成绩,并继续前进。
世界各地数以百万计的操盘手的认可是我们工作的最大赞赏! 您做出了您的选择,我们将尽一切努力来满足您的期望!
我们是一个共同的伟大团队!
InstaSpot. 自豪地为您工作!
GBP/USD
Analysis:
The movement of the major British currency is set by the descending wave algorithm from December 13. Since the beginning of the current year, the price is adjusted. Analysis of the structure shows that this wave is not complete. On February 20, the ascending section started.
Forecast:
The current price growth will likely complete the side correction that has been going on in recent months. Today, the general upward mood of the movement is expected. In the first half of the day, there may be pressure on the support zone. The growth phase can be expected in the afternoon.
Potential reversal zones
Resistance:
- 1.3060/1.3090
Support:
- 1.2980/1.2950
Recommendations:
Until the current wave is complete, purchases of the pound can be risky. They should reduce the lot size. When the price reaches the calculated resistance area, it is recommended to look for sell signals.

USD/JPY
Analysis:
In the short term, the direction of the Japanese yen trend is set by the bullish wave from August 5. By February 20, the price reached the lower limit of the preliminary completion zone. Then there is a sharp decline in the exchange rate. The bearish section has a reversal potential.
Forecast:
There is a high probability that the current decline may be the beginning of a reversal pattern before the trend changes. In the coming trading sessions, you should expect a pullback up. After it is completed, you can wait for a return to the bearish rate.
Potential reversal zones
Resistance:
- 110.90/111.20
Support:
- 110.20/109.90
Recommendations:
Trading on the yen market today is only possible with an intraday trading style. When buying, you should reduce the lot and be ready to exit the deal at the first sign of a reversal. When the price reaches the calculated resistance, it is recommended to start tracking sales signals.
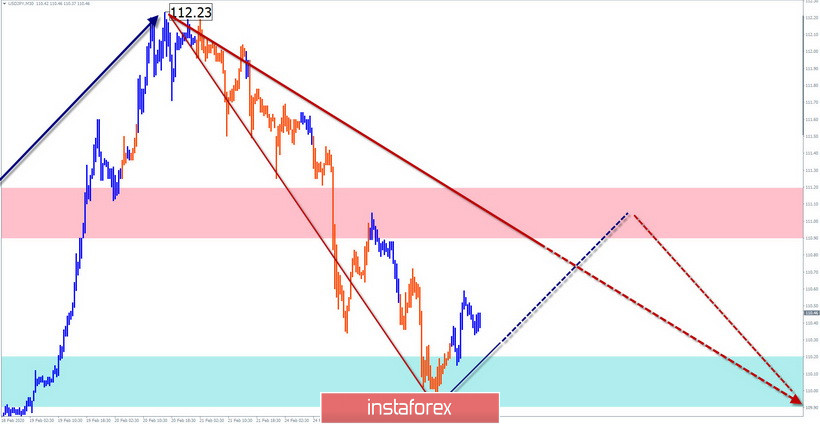
Explanations: In the simplified wave analysis (UVA), waves consist of 3 parts (A-B-C). The last incomplete wave is analyzed. The solid background of the arrows shows the formed structure and the dotted background shows the expected movements.
Note: The wave algorithm does not take into account the duration of the tool's movements in time!
*这里的市场分析是为了增加您对市场的了解,而不是给出交易的指示。
InstaSpot分析评论将让您充分了解市场趋势! 作为InstaSpot的客户,您将获得大量的免费服务以实现有效的交易。


