


The legend in the InstaSpot team!
Legend! You think that's bombastic rhetoric? But how should we call a man, who became the first Asian to win the junior world chess championship at 18 and who became the first Indian Grandmaster at 19? That was the start of a hard path to the World Champion title for Viswanathan Anand, the man who became a part of history of chess forever. Now one more legend in the InstaSpot team!


Borussia is one of the most titled football clubs in Germany, which has repeatedly proved to fans: the spirit of competition and leadership will certainly lead to success. Trade in the same way that sports professionals play the game: confidently and actively. Keep a "pass" from Borussia FC and be in the lead with InstaSpot!
EUR/USD is struggling to find direction on Thursday and continues to fluctuate in a relatively tight range around mid-1.1600s. Mixed data releases from the US don't seem to be having a noticeable impact on the greenback's performance against its major rivals.
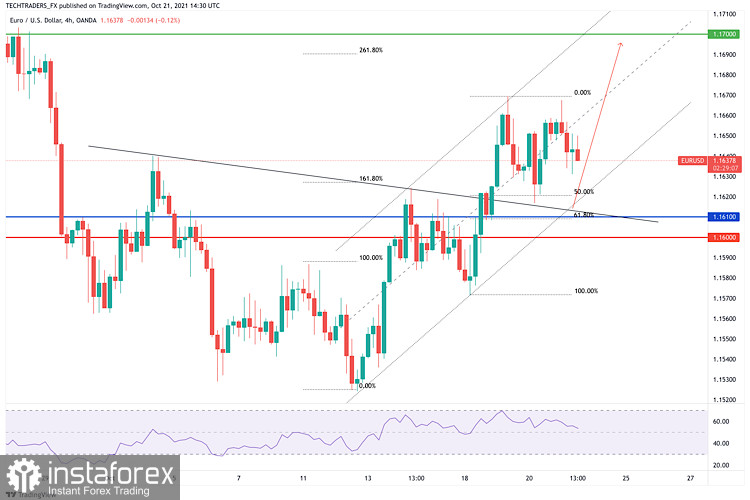
The EUR/USD pair keeps trading between Fibonacci levels, meeting sellers around the 38.2% retracement level of 1.1908/1.1523 from where it is about to slide to 1.1670. The daily chart shows that buyers are losing interest as technical indicators are turning south just above their midlines. At the same time, the pair is developing a movement above a firmly bearish 20 SMA, which stands a few pips below the immediate Fibonacci support level at 1.1615.
The risk is also skewed to the downside in the near term as the 4-hour chart shows that the Momentum indicator turned firmly bearish and is currently pressuring its midline, while the RSI indicator consolidates at around 56. At the same time, the pair remains above a bullish 20 SMA, a few pips below the current level. The bearish case will be firmer if the pair breaks below the 1.1610 price zone.
Support levels: 1.1615 1.1570 1.1525
Resistance levels: 1.1670 1.1715 1.1750
*这里的市场分析是为了增加您对市场的了解,而不是给出交易的指示。
InstaSpot分析评论将让您充分了解市场趋势! 作为InstaSpot的客户,您将获得大量的免费服务以实现有效的交易。


