


4-hour timeframe
Amplitude of the last 5 days (high-low): 93p - 49p - 42p - 59p - 55p.
Average volatility over the past 5 days: 60p (average).
The first trading day of the week ends with growth for the euro/dollar currency pair. The upward movement is absolutely characteristic in strength for Monday and completely fits into the current framework of volatility. The only thing is that the direction of movement does not correspond to the general trend. In fact, the currency pair continued to adjust, and the overall size of the correction made it possible for quotes to go beyond the critical line, so now formally a downward trend has again changed to an upward one. We still believe that the general fundamental background remains in favor of the US currency, however, recent events regarding the military conflict between the United States and Iran, a weak business activity index in the US ISM services sector, and also today's macroeconomic statistics still give a definite advantage to the European currency. The main question now is whether traders will take advantage of the provided weakness of the US currency.
The military conflict between the United States and Iran, has no special effect on foreign exchange markets so far. However, it could have, if it develops, if the parties continue to exchange blows, each of which will be human lives and deaths. Moreover, potentially we are talking about possible terrorist attacks, about open attacks on the United States and Iran. America's military capabilities are, of course, disproportionately greater, but this does not mean that Baghdad will remain unanswered. Therefore, we believe that if the conflict is not resolved in the near future, then in the long term, subject to the deployment of full-scale military operations, the US currency may begin to feel pressure on itself. So far, anonymous sources report that the Iranian government has stepped up the increased combat readiness of all missile forces in the country.
Meanwhile, European macroeconomic statistics pleased traders for the first time in a long time. According to the results of November, retail sales in Germany grew by 2.8% Y/Y which is much higher than the forecasts +0.8%. Indices of business activity in the services sector of the EU countries all turned out to be better than forecasted values. The same can be said of composite business activity indices. In Spain, the service sector showed growth to 54.9, in Italy to 51.1, unchanged at 52.4 in France, to 52.9 in Germany, and in the EU as a whole - to 52.8. It should also be noted that even the British index of business activity in the service sector increased and returned to the growth zone - 50.0. Thus, such values of business activity in the EU countries are indeed the basis for the growth of the euro by 30-40 points, but hardly more. We recommend that traders do not make hasty conclusions in the current situation. Yes, business activity in the service sector has shown positive dynamics, but this does not mean that the EU economy is now on the path to recovery and acceleration. Recall that the industrial sector and business activity in it remain at extremely weak levels. Thus, today's macroeconomic publications have deservedly provided local support for the euro, but the overall picture, in fact, does not change.
Furthermore, one cannot fail to note the business activity index in the US services sector for December, which grew from 52.2 to 52.8, as well as the composite business activity index, which showed growth to 52.7. Thus, macroeconomic statistics from overseas turned out to be positive, and at the US trading session caused restrained purchases of the dollar. In fact, we even get more or less identical situations. In the eurozone and the United States, manufacturing business activity is below 50 (in America, judging by the ISM index). Thus, it is in these indicators that even a certain equality of economies can be noted. However, this is practically the only indicator in which such equality can be recorded. Much more significant indicators of industrial production, GDP, inflation, unemployment, wages remain in favor of the United States. Thus, we continue to stand our ground and expect a new downward trend for the euro/dollar pair.
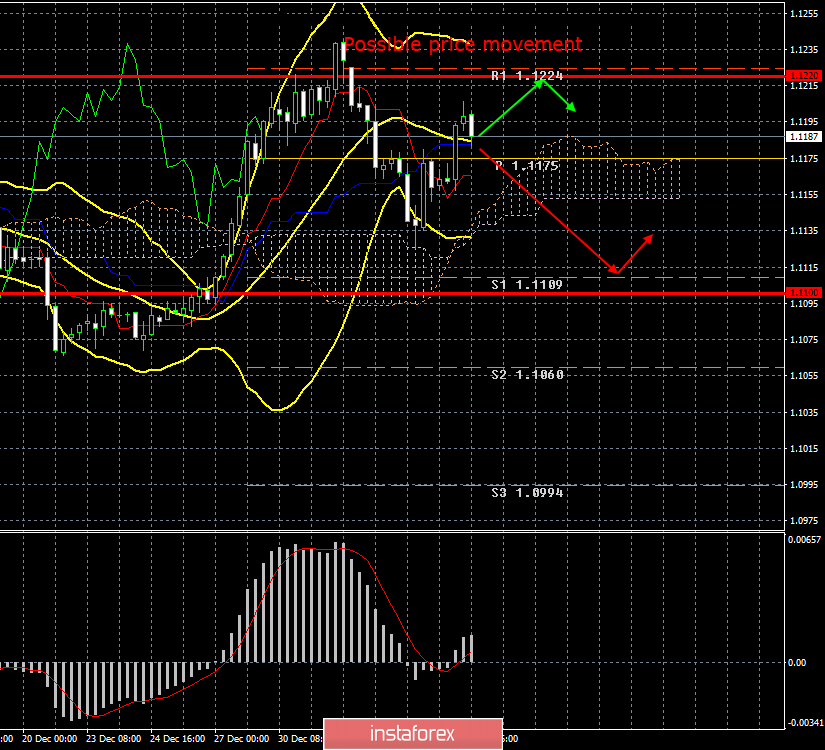
The technical picture of the pair now, by and large, does not signal anything discouraging. The upward correction is currently getting stronger than originally expected. Yes, now it is even possible to resume an upward trend, as in the framework of the previous downward movement, the bears failed to work out the important line of Senkou Span B. Tomorrow two important macroeconomic reports will be published - preliminary inflation in the EU for December and the ISM index of business activity in the US for December.
Trading recommendations:
The EUR/USD pair is still being adjusted and is preparing to resume the downward movement. Thus, now it is recommended for traders to wait for the correction to finish, to consolidate the price back below the Kijun-sen line and to trade lower Senkou Span B line with the first goals and the support level of 1.1109. You can formally consider buying the pair now, but we believe that the likelihood of continued upward movement is still low.
Explanation of the illustration:
Ichimoku indicator:
Tenkan-sen is the red line.
Kijun-sen is the blue line.
Senkou Span A - light brown dotted line.
Senkou Span B - light purple dashed line.
Chikou Span - green line.
Bollinger Bands Indicator:
3 yellow lines.
MACD indicator:
Red line and bar graph with white bars in the indicators window.
Support / Resistance Classic Levels:
Red and gray dotted lines with price symbols.
Pivot Level:
Yellow solid line.
Volatility Support / Resistance Levels:
Gray dotted lines without price designations.
Possible price movement options:
Red and green arrows.
*这里的市场分析是为了增加您对市场的了解,而不是给出交易的指示。
InstaSpot分析评论将让您充分了解市场趋势! 作为InstaSpot的客户,您将获得大量的免费服务以实现有效的交易。


