


The legend in the InstaSpot team!
Legend! You think that's bombastic rhetoric? But how should we call a man, who became the first Asian to win the junior world chess championship at 18 and who became the first Indian Grandmaster at 19? That was the start of a hard path to the World Champion title for Viswanathan Anand, the man who became a part of history of chess forever. Now one more legend in the InstaSpot team!


Borussia is one of the most titled football clubs in Germany, which has repeatedly proved to fans: the spirit of competition and leadership will certainly lead to success. Trade in the same way that sports professionals play the game: confidently and actively. Keep a "pass" from Borussia FC and be in the lead with InstaSpot!
4-hour timeframe
The amplitude of the last 5 days (high-low): 102p - 44p - 172p - 102p - 73p.
Average amplitude for the last 5 days: 99p (99p).
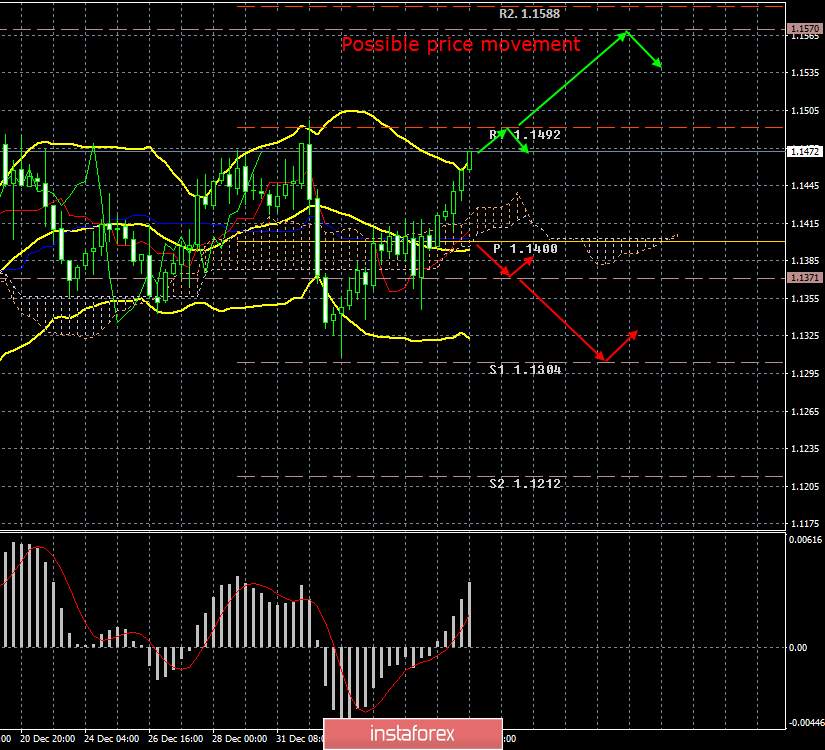
The EUR/USD currency pair continued its upward movement on Monday, January 7, not too strong, but confident and recoilless. There were few macroeconomic reports published on the first trading day of the week, and there were no important ones at all. Retail sales in the eurozone rose 0.6% month-on-month in November, slightly above forecasts. However, it is unlikely that this report had provoked increased demand for the euro. We continue to insist that the current growth of the euro is just a technical recovery after the fall of January 2. Currently the pair has already almost completely regained all the losses, so the future fate of the euro will be decided around the resistance level of 1.1492. We believe that the suspension of the US government is not the reason for the decline of the US currency, as well as the latest dove performance by Jerome Powell. The EUR/USD pair in recent weeks is in a pronounced side channel with a slight upward bias. Frequent corrections, or rather jumps up and down, is a completely normal phenomenon for the side channel. Thus, we cannot say that the euro has risen in price, as a few days ago it fell significantly. On this basis, the bulls will be able to confirm their intentions if they overcome the level of 1.1492. In this case, the chances of continuing the upward movement will increase. But now it looks as if there will be another turn down.
Trading recommendations:
The EUR/USD pair continues a slight upward movement. Therefore, purchase orders with the target of 1.1492 are relevant now. Around this level, the pair may turn down and begin a round of downward movement.
It is recommended to reconsider shorts in small lots (since the flat is preserved) with targets at 1.1371 and 1.1304, if traders fix the pair below the Kijun-sen critical line. Talking about a change in the trend in this case is not necessary, but in the short term this will indicate a downward movement.
In addition to the technical picture, fundamental data and the timing of their release should also be taken into account.
Explanation of illustration:
Ichimoku Indicator:
Tenkan-sen-red line.
Kijun-sen – blue line.
Senkou span a – light brown dotted line.
Senkou span B – light purple dotted line.
Chikou span – green line.
Bollinger Bands Indicator:
3 yellow lines.
MACD:
Red line and histogram with white bars in the indicator window.
*这里的市场分析是为了增加您对市场的了解,而不是给出交易的指示。
InstaSpot分析评论将让您充分了解市场趋势! 作为InstaSpot的客户,您将获得大量的免费服务以实现有效的交易。


