


我们的团队有超过700万的操盘手!
我们每天都在一起努力改善交易。我们得到了很高的成绩,并继续前进。
世界各地数以百万计的操盘手的认可是我们工作的最大赞赏! 您做出了您的选择,我们将尽一切努力来满足您的期望!
我们是一个共同的伟大团队!
InstaSpot. 自豪地为您工作!


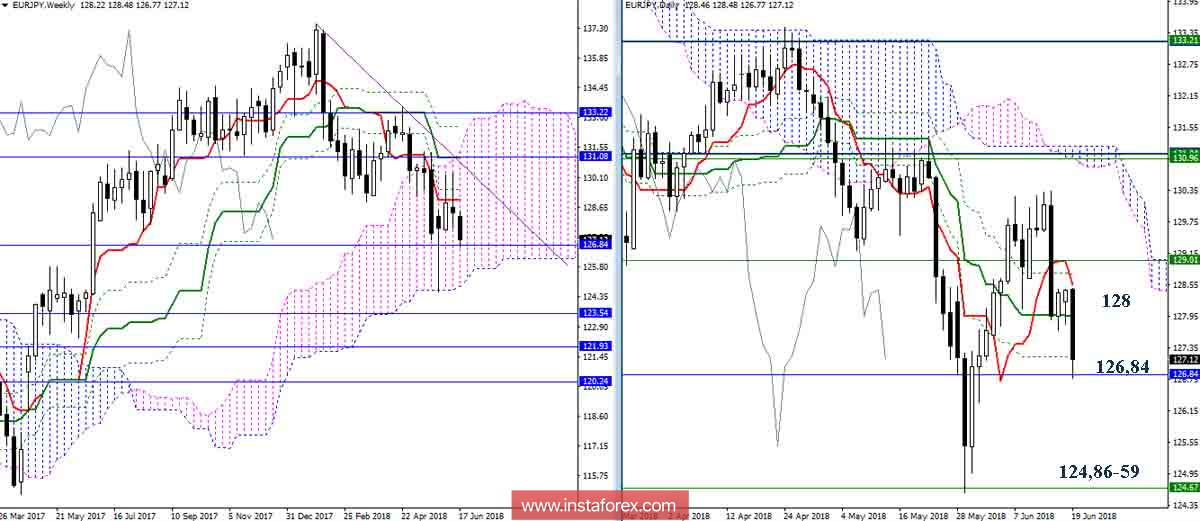
EUR / JPY
The decline was continued and to date, the pair is testing the Fibo Kijun support zone (daily 127.17 + monthly 126.84). Overcoming this support zone opens new prospects for players to lower. The main task will be testing the lower boundary of the weekly cloud (Senkou Span B 124.86) and restoring the downtrend (minimum extremum 124.59).
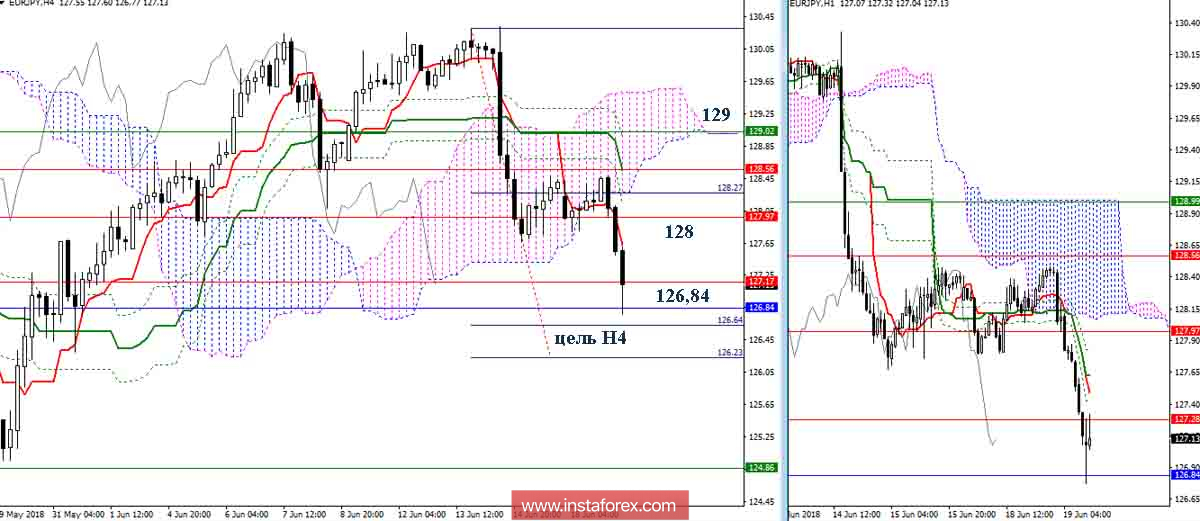
Younger time intervals confirm that a broad enough and strengthened support zone has been met. The support for the higher halves (127.17 - 126.86) + the target for the breakdown of the H4 cloud (126.23-64). As a result, you will need strength and time to overcome this zone. In this situation, the bulls return their positions can change the current balance of power and affect the implementation of bearish plans. The intermediate level of resistance is located today in the area of 128 (cross H1 + cloud H1 + Tenkan N4 + day Kijun), but the most important and significant is the return of line 129.
Indicator parameters:
All time intervals 9 - 26 - 52
The color of indicator lines:
Tenkan (short-term trend) - red,
Kijun (medium-term trend) - green,
Fibo Kijun is a green dotted line,
Chinkou is gray,
Clouds: Senkou Span B (SSB, long-term trend) - blue,
Senkou Span A (SSA) - pink.
The color of additional lines:
Support and resistance MN - blue, W1 - green, D1 - red, H4 - pink, H1 - gray,
Horizontal levels (not Ichimoku) - brown,
Trend lines - purple.
*这里的市场分析是为了增加您对市场的了解,而不是给出交易的指示。
InstaSpot分析评论将让您充分了解市场趋势! 作为InstaSpot的客户,您将获得大量的免费服务以实现有效的交易。


