


The legend in the InstaSpot team!
Legend! You think that's bombastic rhetoric? But how should we call a man, who became the first Asian to win the junior world chess championship at 18 and who became the first Indian Grandmaster at 19? That was the start of a hard path to the World Champion title for Viswanathan Anand, the man who became a part of history of chess forever. Now one more legend in the InstaSpot team!


Borussia is one of the most titled football clubs in Germany, which has repeatedly proved to fans: the spirit of competition and leadership will certainly lead to success. Trade in the same way that sports professionals play the game: confidently and actively. Keep a "pass" from Borussia FC and be in the lead with InstaSpot!
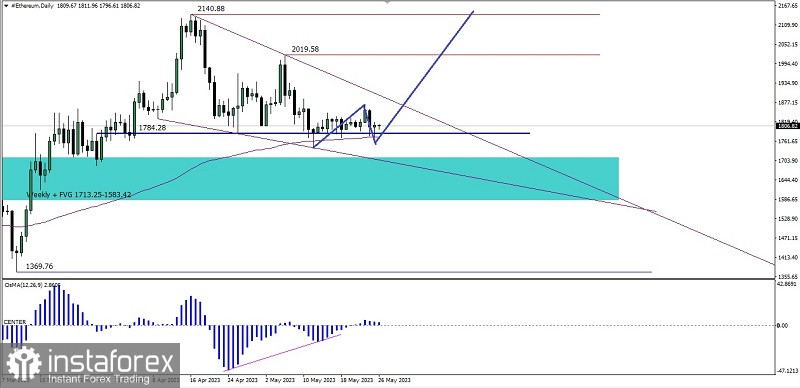
There are several interesting things if we look at the daily chart of the Ethereum cryptocurrency:
1. The emergence of the Bullish Continuation = Failing Wedge pattern.
2. The appearance of hidden deviations between price movements and the osMA indicator.
3. Price movement was again halted at the Bullish Orderblock support level 1784.28 for the umpteenth time.
4. Apart from moving above the EMA 100, the price movement of Ethereum is also stuck at the dynamic 100 level which also happens to intersect with the support level of the Bullish Orderblock.
Based on the four facts above, Ethereum today as long as there is no deeper decline below the 1543.52 level in the near future has the potential to appreciate upwards to break above the 1871.82 level. If this level is successfully broken above, Ethereum will try to test the 2019.58 level as its main target and the level of 2140.88 as the second target.
(Disclaimer)
*这里的市场分析是为了增加您对市场的了解,而不是给出交易的指示。
InstaSpot分析评论将让您充分了解市场趋势! 作为InstaSpot的客户,您将获得大量的免费服务以实现有效的交易。


