




The legend in the InstaSpot team!
Legend! You think that's bombastic rhetoric? But how should we call a man, who became the first Asian to win the junior world chess championship at 18 and who became the first Indian Grandmaster at 19? That was the start of a hard path to the World Champion title for Viswanathan Anand, the man who became a part of history of chess forever. Now one more legend in the InstaSpot team!





Borussia is one of the most titled football clubs in Germany, which has repeatedly proved to fans: the spirit of competition and leadership will certainly lead to success. Trade in the same way that sports professionals play the game: confidently and actively. Keep a "pass" from Borussia FC and be in the lead with InstaSpot!

The wave count on the four-hour chart for EUR/USD is becoming more complex. There is still no question of canceling the bullish phase of the trend (bottom chart), which began in January of last year. On the contrary, we have seen a complete A-B-C corrective structure, which may have been completed. However, recent events related to the Fed and its policy have once again affected the current wave count. I would like to remind you that the news backdrop and wave count often conflict with each other, making adjustments necessary.
The wave count may now become more complex again. Wave C has taken a three-wave form, while the next wave is identified as Wave D. The entire trend segment that began on January 27 may now take the form of a five-wave corrective structure, A-B-C-D-E. If this assumption is correct, Wave D has been completed, and on August 21, EUR/USD entered the phase of forming Wave E, whose low should be below the low of Wave C at 1.1325. The only question now is whether the news backdrop will support the dollar strongly enough for the pair to fall below 1.1325. We get the answer to this question every day: such news support is not necessary.
What Has Been Happening in the Market Over the Past Year?
The EUR/USD pair rose by several dozen points during Friday's trading session, but in today's review, I suggest looking not at the news backdrop or the events of the current day, but at the broader picture. In my view, the latest rise in the US currency is difficult to explain and has little to do with recent events in the world or in the United States. Consider the following: the Fed has raised its interest rate once and indicated its willingness to continue tightening. At the same time, the ECB has raised rates twice and is also prepared to continue tightening. The Bank of England has not raised rates at all yet, but is prepared to raise them twice over its next three meetings. Everything suggests that the dollar, euro, and pound are in roughly similar conditions. Why, then, has only the dollar been rising in recent weeks?
Look at the wave count in the bottom chart, which reflects this year's price movements. This picture provides grounds for identifying the 1.13–1.14 level as the lower boundary of the channel for the current year. In other words, the euro has fallen to the year's lows for the third time. This is important because I cannot describe the latest decline in the pair as a logical continuation of the preceding movement. If we look further back on the chart, we can see that during the second half of 2025, price movements with a similar structure but in the opposite direction took place. Last year, the pair moved higher in a series of successive advances, while this year it has moved lower in a series of successive declines. If these movements are considered together, EUR/USD has effectively been trading between the 1.13 and 1.19 levels for approximately a year. The euro is now in the lower part of this range. Should we expect another rise?
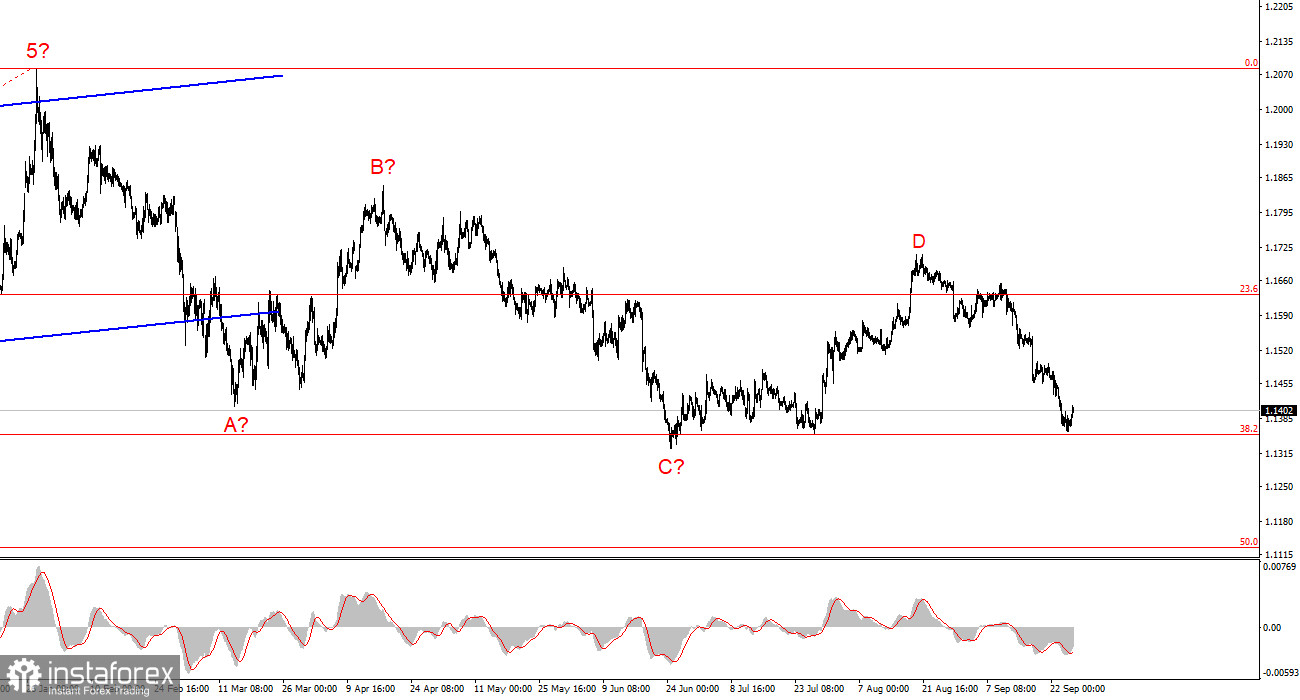
Based on my EUR/USD analysis, I conclude that the pair remains within a global corrective A-B-C-D-E trend structure. If this assumption is correct, the decline will continue toward targets below the low of Wave C at 1.1325. I previously considered this scenario an alternative one, and had it not been for the Fed meeting, it would have remained a secondary scenario. However, the Fed delivered a surprise, leaving the market with no other option but a new wave of US currency purchases. Yet these purchases have continued for several weeks, even though the dollar has no new supporting factors. I would not open short positions against such a news backdrop.
On the higher timeframe, a bullish phase of the trend can be seen, followed by the formation of an A-B-C corrective structure. This structure could develop into a five-wave pattern, but at present I consider it complete. If that is the case, a new impulsive bullish phase of the trend has begun to form.
The Main Principles of My Analysis:
*এখানে পোস্ট করা মার্কেট বিশ্লেষণ আপনার সচেতনতা বৃদ্ধির জন্য প্রদান করা হয়, ট্রেড করার নির্দেশনা প্রদানের জন্য প্রদান করা হয় না।
ইন্সটাফরেক্স বিশ্লেষণমূলক পর্যালোচনাগুলো আপনাকে মার্কেট প্রবণতা সম্পর্কে পুরোপুরি সচেতন করবে! ইন্সটাফরেক্সের একজন গ্রাহক হওয়ায়, দক্ষ ট্রেডিং এর জন্য আপনাকে অনেক সেবা বিনামূল্যে প্রদান করা হয়।


