




Our team has over 7,000,000 traders!
Every day we work together to improve trading. We get high results and move forward.
Recognition by millions of traders all over the world is the best appreciation of our work! You made your choice and we will do everything it takes to meet your expectations!
We are a great team together!
InstaSpot. Proud to work for you!





Actor, UFC 6 tournament champion and a true hero!
The man who made himself. The man that goes our way.
The secret behind Taktarov's success is constant movement towards the goal.
Reveal all the sides of your talent!
Discover, try, fail - but never stop!
InstaSpot. Your success story starts here!

Bitcoin continued to trade around $64,500, while Ethereum also moved closer to $1,900, preparing for another attempt to reach the $2,000 level.

Meanwhile, discussions are ongoing online regarding Bitcoin's four-year cycle. If this cycle is still valid, Bitcoin is currently located precisely within its historical bottom zone. The calculation based on the date of the latest halving, which took place on April 20, 2024, shows that approximately 850 days have passed since this event as of today, August 18, 2026. This figure only becomes meaningful when compared with the history of the previous three cycles.
After the first halving on November 28, 2012, the bear market bottom formed in January 2015 at around $152, approximately 778 days after the event. After the second halving on July 9, 2016, the cycle low was reached in mid-December 2018 at around $3,122, 889 days later. After the third halving on May 11, 2020, the bottom at $15,479 was recorded on November 21, 2022, after 924 days. Three consecutive cycles saw the bottom form within a range of 778–924 days after the halving, with the average value being around 864 days. This means that the current cycle's 850 days fall directly within this historical range.
If this pattern is still valid, Bitcoin's current correction does not represent an unusually prolonged bear market but rather its final and statistically most expected phase. In any case, many analysts are already suggesting that if this is not the bottom, then it is likely close. Therefore, it is necessary to pay closer attention to what is currently happening in the market.
Bitcoin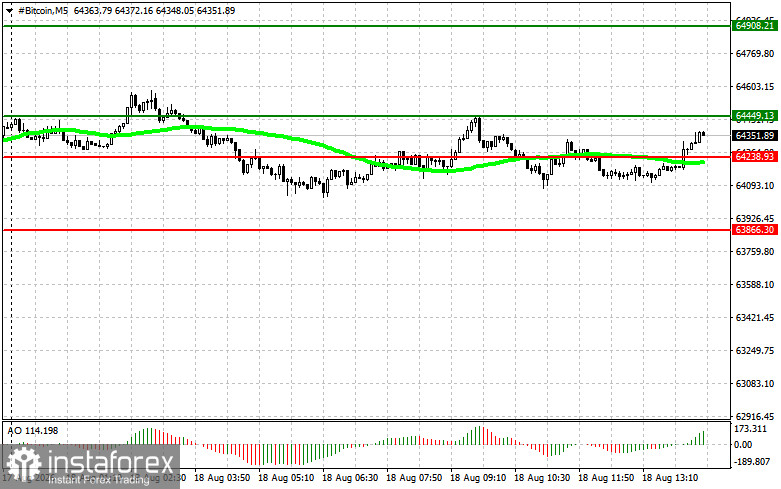
Scenario #1: I will buy Bitcoin today if the entry point is reached around $64,500, with a target of growth toward $64,900. Around $64,900, I will exit long positions and sell immediately on a rebound. Before buying on a breakout, it is necessary to confirm that the 50-day moving average is below the current price and that the Awesome Oscillator is above zero.
Scenario #2: Bitcoin can be bought from the lower boundary of $64,200 if there is no market reaction to its breakout in the opposite direction toward the levels of $64,500 and $64,900.
Scenario #1: I will sell Bitcoin today if the entry point is reached around $64,200, with a target of decline toward $63,800. Around $63,800, I will exit short positions and buy immediately on a rebound. Before selling on a breakout, it is necessary to confirm that the 50-day moving average is above the current price and that the Awesome Oscillator is below zero.
Scenario #2: Bitcoin can be sold from the upper boundary of $64,500 if there is no market reaction to its breakout in the opposite direction toward the levels of $64,200 and $63,800.
Ethereum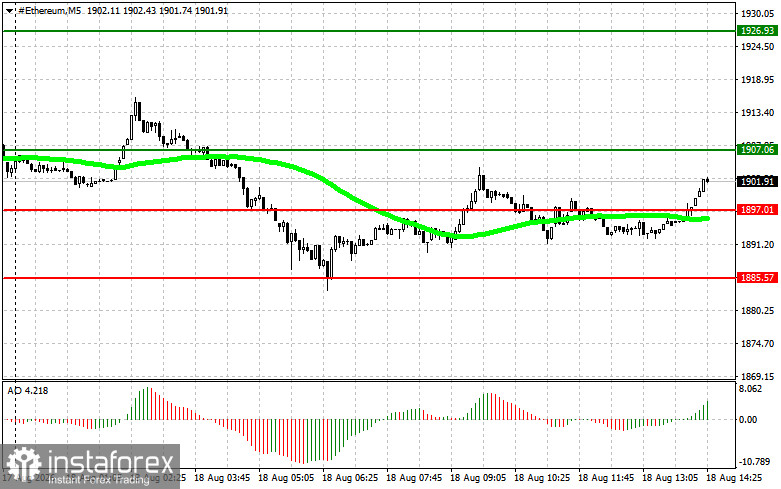
Scenario #1: I will buy Ethereum today if the entry point is reached around $1,907, with a target of growth toward $1,926. Around $1,926, I will exit long positions and sell immediately on a rebound. Before buying on a breakout, it is necessary to confirm that the 50-day moving average is below the current price and that the Awesome Oscillator is above zero.
Scenario #2: Ethereum can be bought from the lower boundary of $1,897 if there is no market reaction to its breakout in the opposite direction toward the levels of $1,907 and $1,926.
Scenario #1: I will sell Ethereum today if the entry point is reached around $1,897, with a target of decline toward $1,885. Around $1,885, I will exit short positions and buy immediately on a rebound. Before selling on a breakout, it is necessary to confirm that the 50-day moving average is above the current price and that the Awesome Oscillator is below zero.
Scenario #2: Ethereum can be sold from the upper boundary of $1,907 if there is no market reaction to its breakout in the opposite direction toward the levels of $1,897 and $1,885.
*এখানে পোস্ট করা মার্কেট বিশ্লেষণ আপনার সচেতনতা বৃদ্ধির জন্য প্রদান করা হয়, ট্রেড করার নির্দেশনা প্রদানের জন্য প্রদান করা হয় না।
ইন্সটাফরেক্স বিশ্লেষণমূলক পর্যালোচনাগুলো আপনাকে মার্কেট প্রবণতা সম্পর্কে পুরোপুরি সচেতন করবে! ইন্সটাফরেক্সের একজন গ্রাহক হওয়ায়, দক্ষ ট্রেডিং এর জন্য আপনাকে অনেক সেবা বিনামূল্যে প্রদান করা হয়।


