


The legend in the InstaSpot team!
Legend! You think that's bombastic rhetoric? But how should we call a man, who became the first Asian to win the junior world chess championship at 18 and who became the first Indian Grandmaster at 19? That was the start of a hard path to the World Champion title for Viswanathan Anand, the man who became a part of history of chess forever. Now one more legend in the InstaSpot team!


Borussia is one of the most titled football clubs in Germany, which has repeatedly proved to fans: the spirit of competition and leadership will certainly lead to success. Trade in the same way that sports professionals play the game: confidently and actively. Keep a "pass" from Borussia FC and be in the lead with InstaSpot!

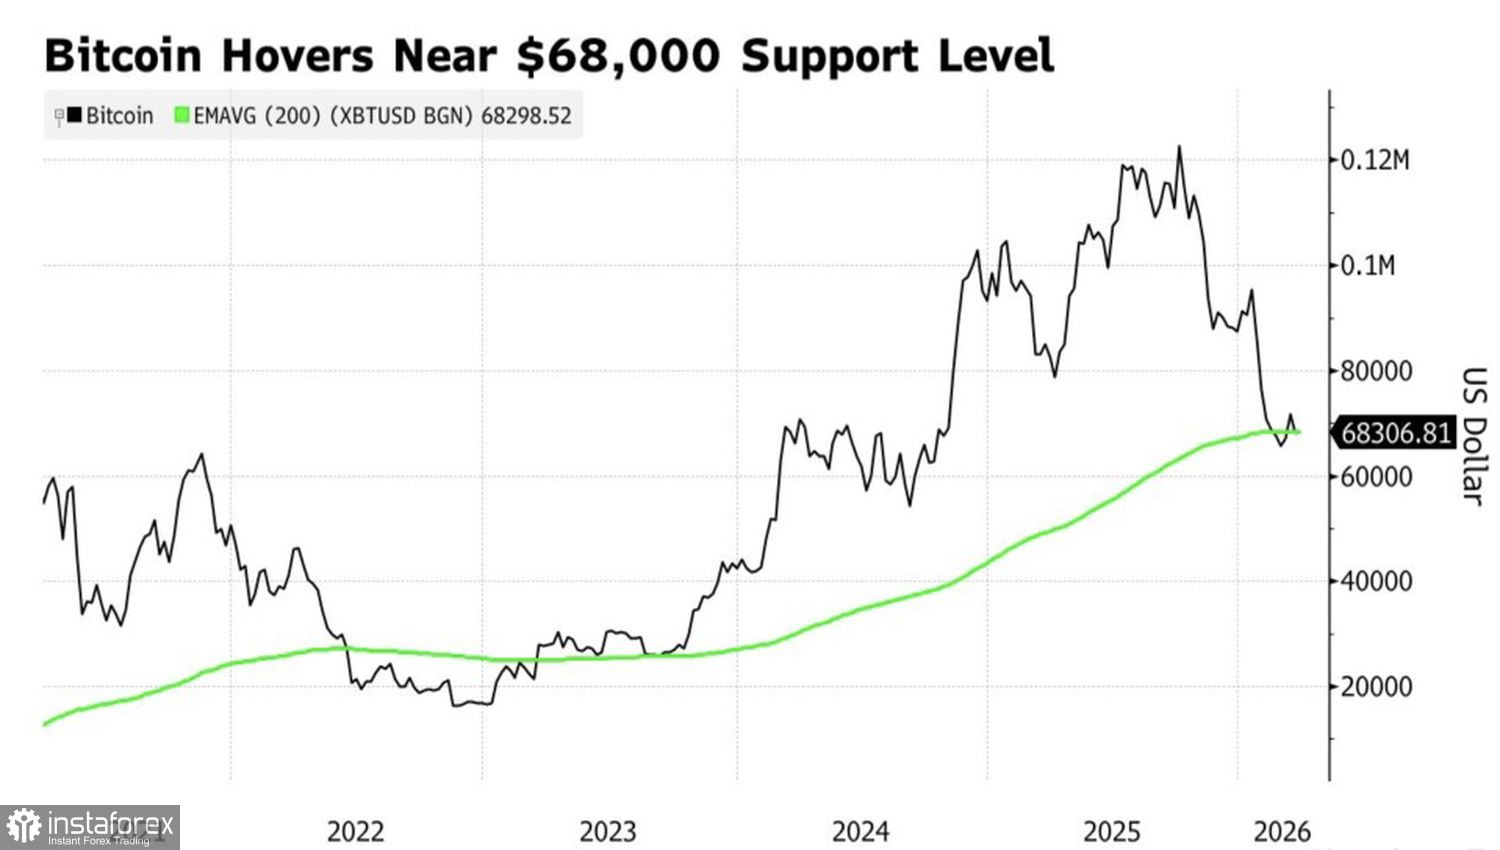
What's good and what's bad? Bitcoin has both positive and negative news. The crypto has outperformed gold and other financial assets during the Middle East crisis. That fuels debate over whether it is a safe?haven asset or not. Yet, favorable changes in US legislation have not produced the boom that crypto fans expected. Hence, BTC/USD is oscillating in a relatively narrow trading range of $64,000–$74,000.
Investors cannot settle on Bitcoin's status. Is it a risky asset, as suggested by a high correlation with US stock indices — especially big tech? Or is it actually a reliable asset? During the Middle East conflict, it has outpaced traditional havens such as gold, US Treasuries, the yen, and the Swiss franc. Those assets have fallen significantly while the token continues to test dynamic support in the form of moving averages.
Bitcoin and moving-average dynamics
ETF flows offer no clear answer. Over the three days to 20 March, there were outflows of $305.8 million from Bitcoin-focused ETFs. Nevertheless, inflows were recorded earlier in the five days, and ETF reserves rose by $95 million over the week.
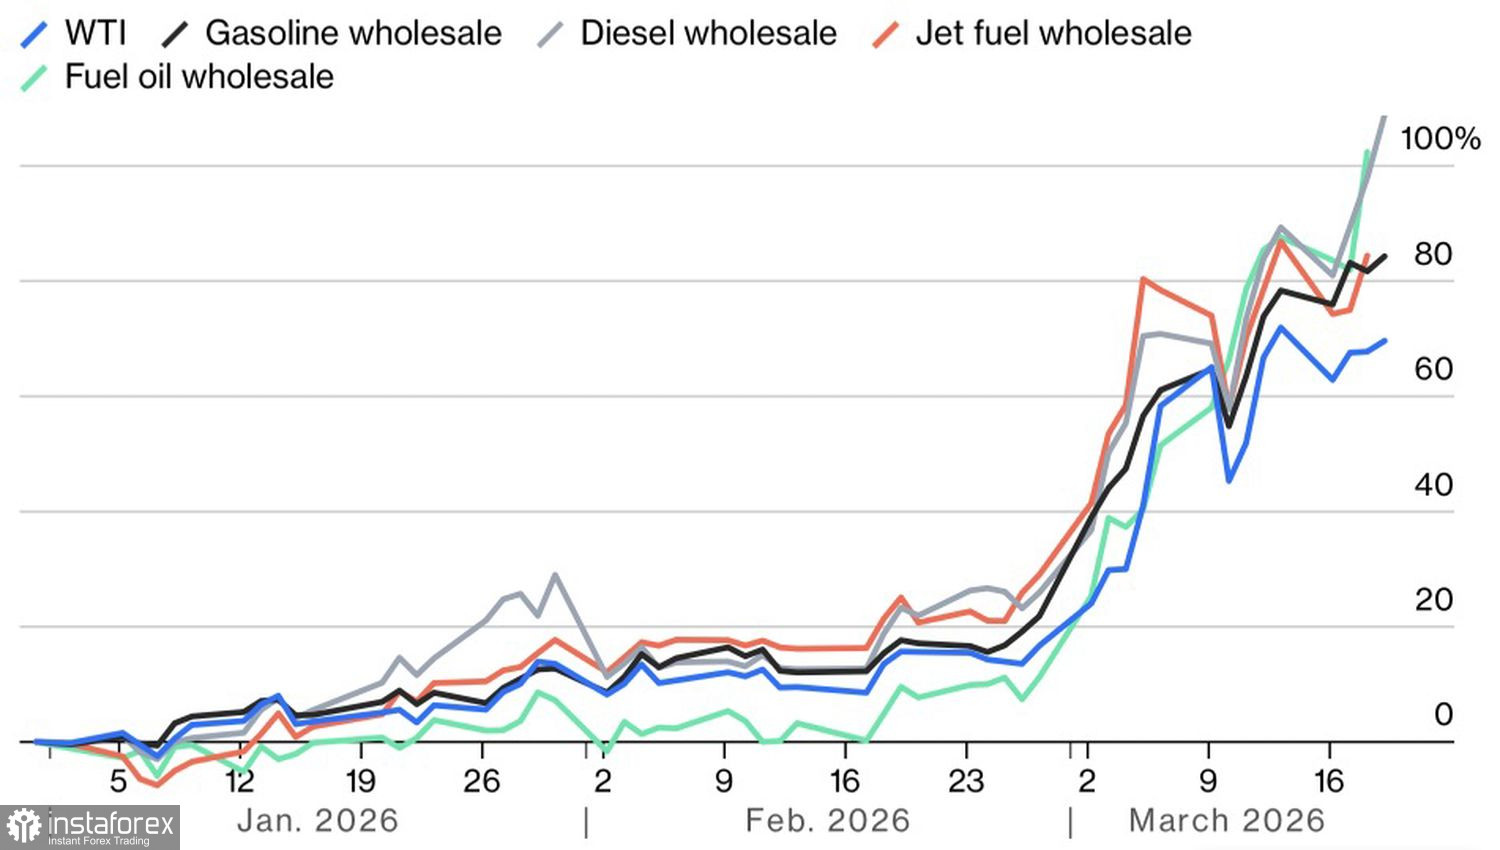
You won't find the truth in other indicators either. For example, CoinGlass's crypto market sentiment index has been in the fear zone for 25 of the last 30 trading days. At the same time, Bitcoin should theoretically suffer from rising oil, refined-product, and energy prices, since mining requires electricity. Higher energy costs force miners to sell accrued reserves to cover expenses. Increased supply leads to lower BTC/USD.
Oil and refined-product dynamics
In this regard, Goldman Sachs's forecast that the conflict in the Middle East will stretch from the current three weeks to six weeks, with Hormuz reopening only within a month thereafter, is bearish for Bitcoin. US stock indices are undergoing a correction, and a deterioration in global risk appetite is putting pressure on BTC/USD.
Donald Trump's 48?hour ultimatum to Iran is more escalation than de?escalation of geopolitical tension. Few believe Tehran will comply with the White House demand to reopen access to the Strait of Hormuz.
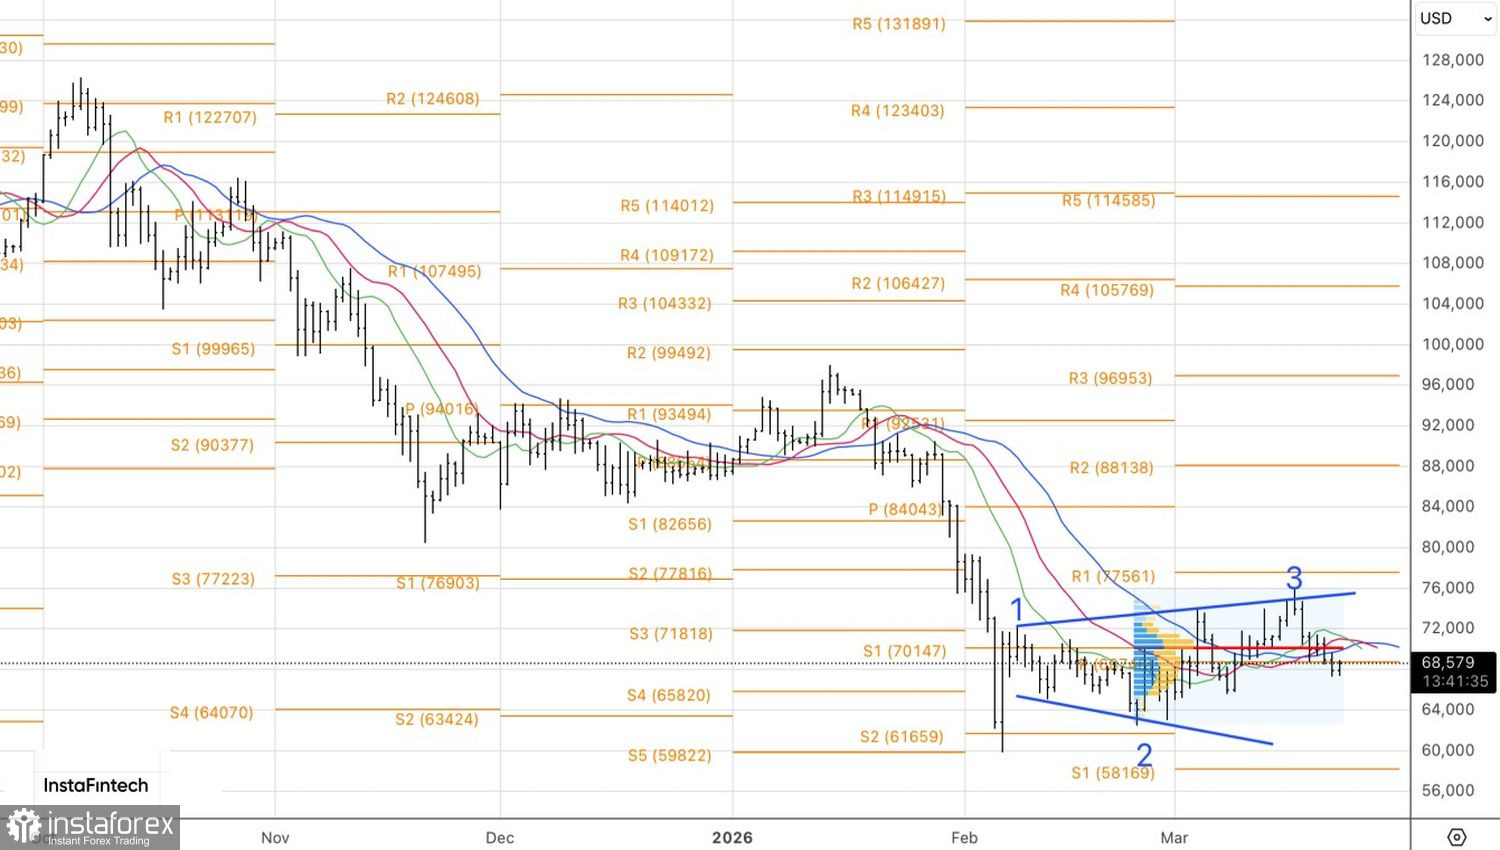
Technically, on the daily chart, BTC/USD is fighting for fair value around $70,000, where the moving averages also sit. A break below the local low at $67,300 would be a sell signal and increase the risk of the formation of a broadening wedge. It would make sense to return to buying only if the cryptocurrency secures a close above the important $72,000 level.
*এখানে পোস্ট করা মার্কেট বিশ্লেষণ আপনার সচেতনতা বৃদ্ধির জন্য প্রদান করা হয়, ট্রেড করার নির্দেশনা প্রদানের জন্য প্রদান করা হয় না।
ইন্সটাফরেক্স বিশ্লেষণমূলক পর্যালোচনাগুলো আপনাকে মার্কেট প্রবণতা সম্পর্কে পুরোপুরি সচেতন করবে! ইন্সটাফরেক্সের একজন গ্রাহক হওয়ায়, দক্ষ ট্রেডিং এর জন্য আপনাকে অনেক সেবা বিনামূল্যে প্রদান করা হয়।


