


Our team has over 7,000,000 traders!
Every day we work together to improve trading. We get high results and move forward.
Recognition by millions of traders all over the world is the best appreciation of our work! You made your choice and we will do everything it takes to meet your expectations!
We are a great team together!
InstaSpot. Proud to work for you!


Actor, UFC 6 tournament champion and a true hero!
The man who made himself. The man that goes our way.
The secret behind Taktarov's success is constant movement towards the goal.
Reveal all the sides of your talent!
Discover, try, fail - but never stop!
InstaSpot. Your success story starts here!


The GBP/USD currency pair posted a significant decline on Friday, entirely at odds with its previous rise. On Thursday, the British currency appreciated amid the Bank of England's hawkish stance on monetary policy, but why did it fall on Friday? That's a rhetorical question. Thus, we saw a break of the descending trend line that did not lead to the formation of a new upward trend. Of course, it is too early to write off the British currency, but the pair fell below the Ichimoku indicator lines on Friday. We would say the probability of a new decline in the pair is higher now, despite the outcomes of the Bank of England and Fed meetings.
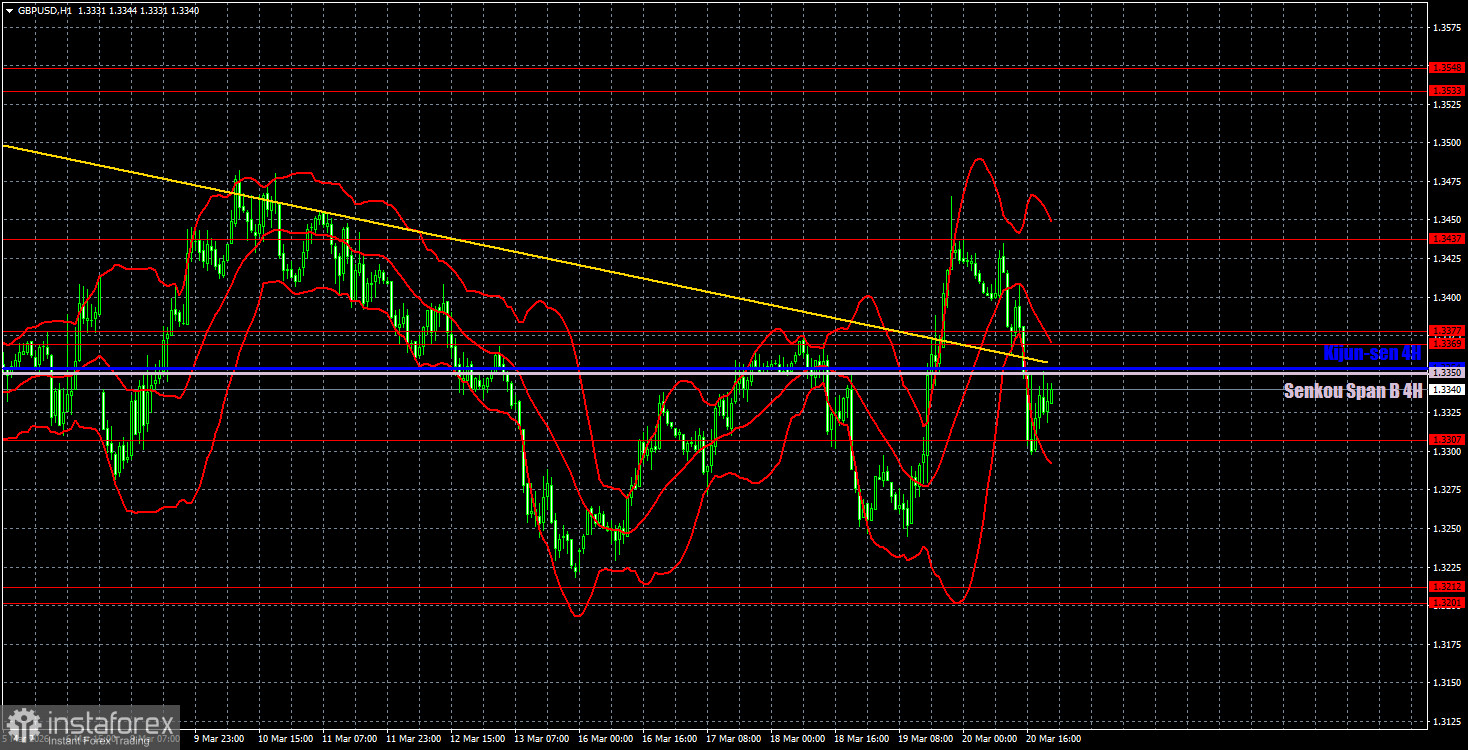
On the hourly timeframe, the trend has officially turned upward, but it's impossible to discuss further growth for the British currency while it's below the Senkou Span B and Kijun-sen lines. Therefore, if the price stabilizes above these lines this week, the pound may have a chance. Otherwise, the decline will continue. If Donald Trump strikes Iran's energy sector, the GBP/USD pair could quickly trade to the 1.3201-1.3212 area.
On the 5-minute timeframe, several decent trading signals were formed on Friday, as the price moved in one direction for almost the entire day. Early in the European trading session, the price formed an ideal sell signal from the 1.3437 level. Later, there were two good signals around the 1.3369-1.3377 area. Subsequently, there were several bounces off the Senkou Span B and Kijun-sen lines. Almost all signals, except for the second one, proved profitable.
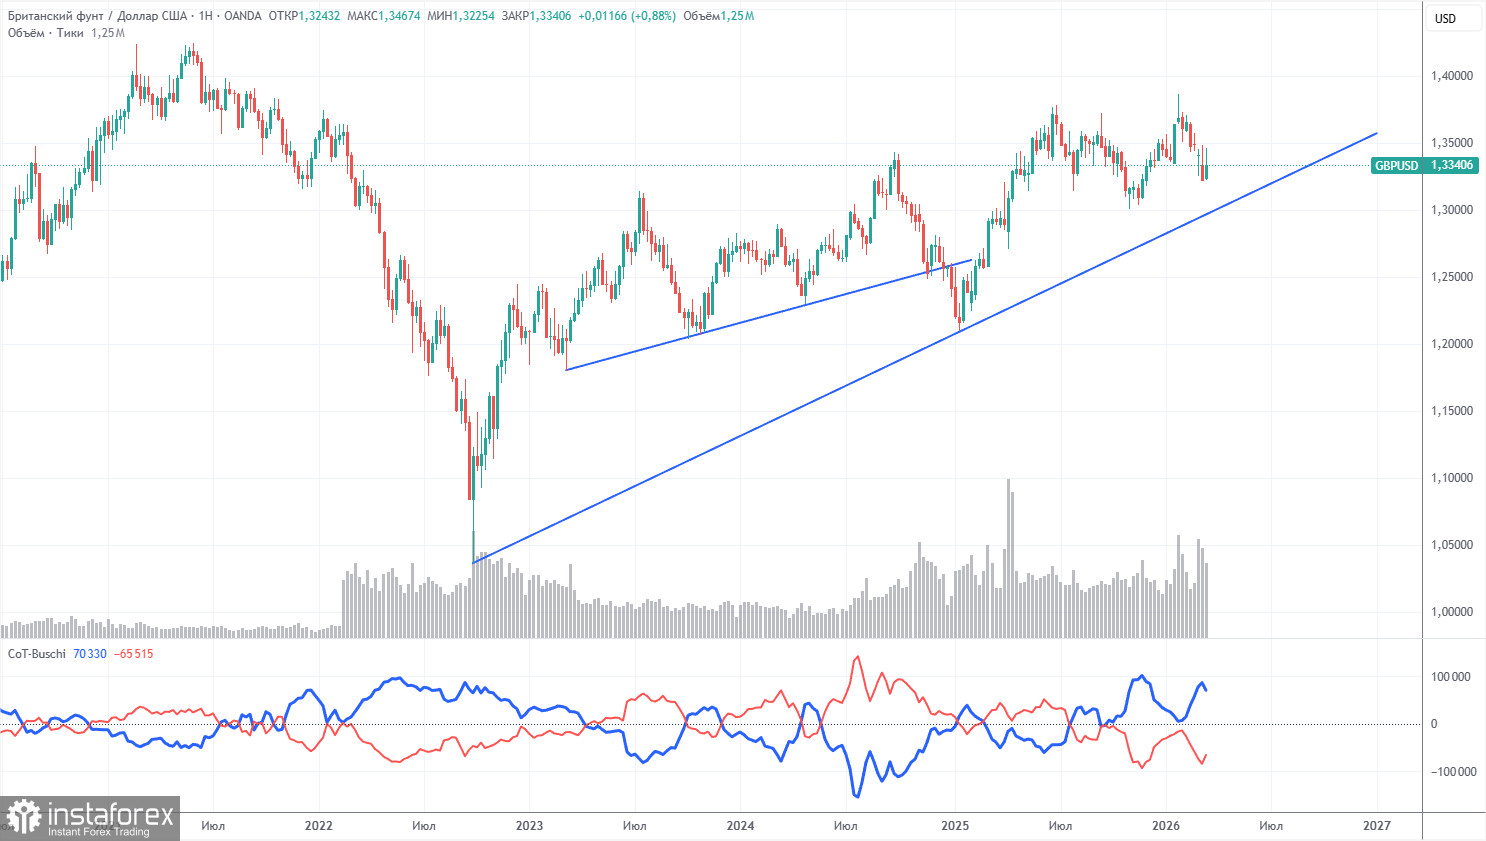
The COT reports for the British pound show that commercial traders' sentiment has been changing steadily in recent years. The red and blue lines, reflecting the net positions of commercial and non-commercial traders, frequently cross and are often close to the zero mark. Currently, the lines are diverging, with non-commercial traders continuing to dominate with... sales. However, given the events in the Middle East, it is no longer surprising that demand for riskier currencies is falling and for the dollar is rising.
In the long term, the dollar continues to decline due to Trump's policies, as shown on the weekly timeframe. The trade war will continue in one form or another for a long time, and the Fed will, in any case, resume easing monetary policy. Demand for the dollar will inevitably fall in the future. However, geopolitical factors are currently at the forefront, providing strong support for the American currency. According to the latest COT report (March 17), the non-commercial group closed 4,900 BUY contracts and 23,700 SELL contracts. Thus, the net position of non-commercial traders increased by 18,800 contracts over the week.
On the hourly timeframe, the GBP/USD pair has finally begun to rise, breaking the downward trend, and has a real chance of recovering losses from the past month and a half. Despite the steep decline in the pair during February-March, we still consider this a correction. The daily timeframe confidently signals the preservation of the upward trend. Unfortunately, geopolitics is highly unpredictable and can overshadow other factors, as we have observed recently.
For March 23, we highlight the following important levels: 1.3096-1.3115, 1.3201-1.3212, 1.3307, 1.3369-1.3377, 1.3437, 1.3533-1.3548, 1.3615, 1.3671-1.3681, 1.3751-1.3763. The Senkou Span B (1.3350) and Kijun-sen (1.3354) lines can also serve as sources of signals. It is recommended to set the Stop Loss at breakeven when the price moves in the right direction by 20 pips. The Ichimoku indicator lines may shift during the day, which should be considered when determining trading signals.
On Monday, there are no significant events or reports planned in the UK or the US. Friday only showed us that the market is still focused solely on the Middle East and is not ready to buy the British pound.
Today, traders may open short positions if the price bounces off the Ichimoku indicator lines, targeting 1.3307 and 1.3201-1.3212. Long positions will become relevant with targets of 1.3437 and 1.3533-1.3548 if the price breaks through the Ichimoku indicator lines and the 1.3369-1.3377 area.
Support and resistance price levels – thick red lines near which movement may end. They are not sources of trading signals.
Kijun-sen and Senkou Span B lines – lines of the Ichimoku indicator transferred to the hourly timeframe from the 4-hour timeframe. They are strong lines.
Extreme levels – thin red lines from which the price has previously bounced. They are sources of trading signals.
Yellow lines – trend lines, trend channels, and any other technical patterns.
Indicator 1 on COT charts – the size of the net position for each category of traders.
*এখানে পোস্ট করা মার্কেট বিশ্লেষণ আপনার সচেতনতা বৃদ্ধির জন্য প্রদান করা হয়, ট্রেড করার নির্দেশনা প্রদানের জন্য প্রদান করা হয় না।
ইন্সটাফরেক্স বিশ্লেষণমূলক পর্যালোচনাগুলো আপনাকে মার্কেট প্রবণতা সম্পর্কে পুরোপুরি সচেতন করবে! ইন্সটাফরেক্সের একজন গ্রাহক হওয়ায়, দক্ষ ট্রেডিং এর জন্য আপনাকে অনেক সেবা বিনামূল্যে প্রদান করা হয়।


