


The legend in the InstaSpot team!
Legend! You think that's bombastic rhetoric? But how should we call a man, who became the first Asian to win the junior world chess championship at 18 and who became the first Indian Grandmaster at 19? That was the start of a hard path to the World Champion title for Viswanathan Anand, the man who became a part of history of chess forever. Now one more legend in the InstaSpot team!


Borussia is one of the most titled football clubs in Germany, which has repeatedly proved to fans: the spirit of competition and leadership will certainly lead to success. Trade in the same way that sports professionals play the game: confidently and actively. Keep a "pass" from Borussia FC and be in the lead with InstaSpot!

The GBP/USD currency pair continued its downward movement on Friday, which, as we have already established, was not related to macroeconomic or fundamental events. Moreover, there were no new geopolitical messages on Friday. The Hormuz Strait remains blocked, Iran has carried out missile and drone strikes on at least six tankers in the region (confirming its intentions to block any oil supplies from the region), oil prices are rising again, and Tehran and Washington have no plans to sit down at the negotiating table anytime soon. This set of factors was enough for the US dollar to continue rising on Friday, despite a disastrous US GDP report and very weak durable goods orders.
By the way, British data also failed to please traders, as the January GDP report was weak, and industrial production was no better. However, it is unlikely that British reports triggered another decline in the British pound. Technically, a downward trend is persisting, which started as a simple correction but has been lasting for a month and a half and could even break the upward trend of 2025...
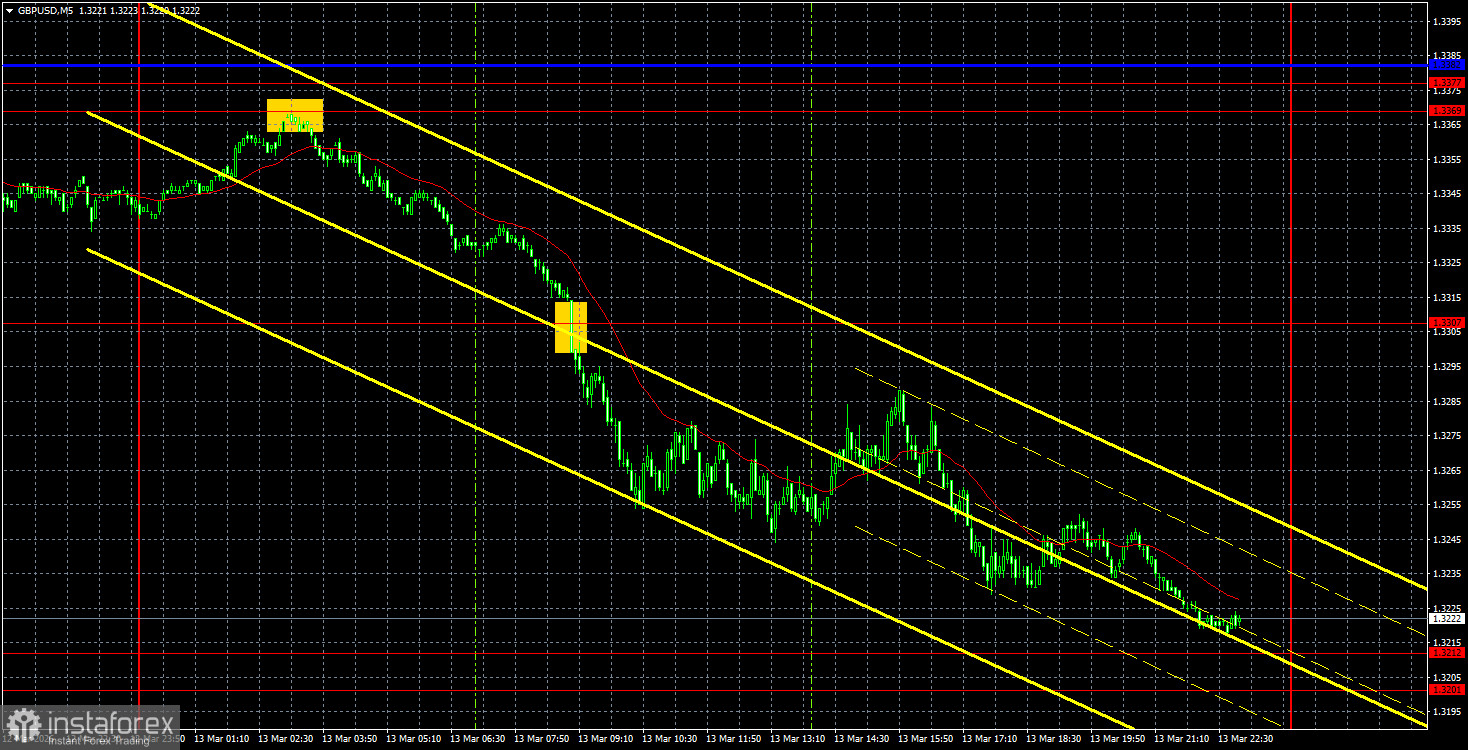
On the 5-minute timeframe, two trading signals were formed on Friday. Overnight, the price bounced from the 1.3369-1.3377 area, and during the European trading session, it broke the 1.3307 level. Thus, traders had at least two opportunities to open short positions. By the end of the day, the pair had almost dropped to the 1.3201-1.3212 range, where short positions could be closed comfortably, allowing traders to rest over the weekend.
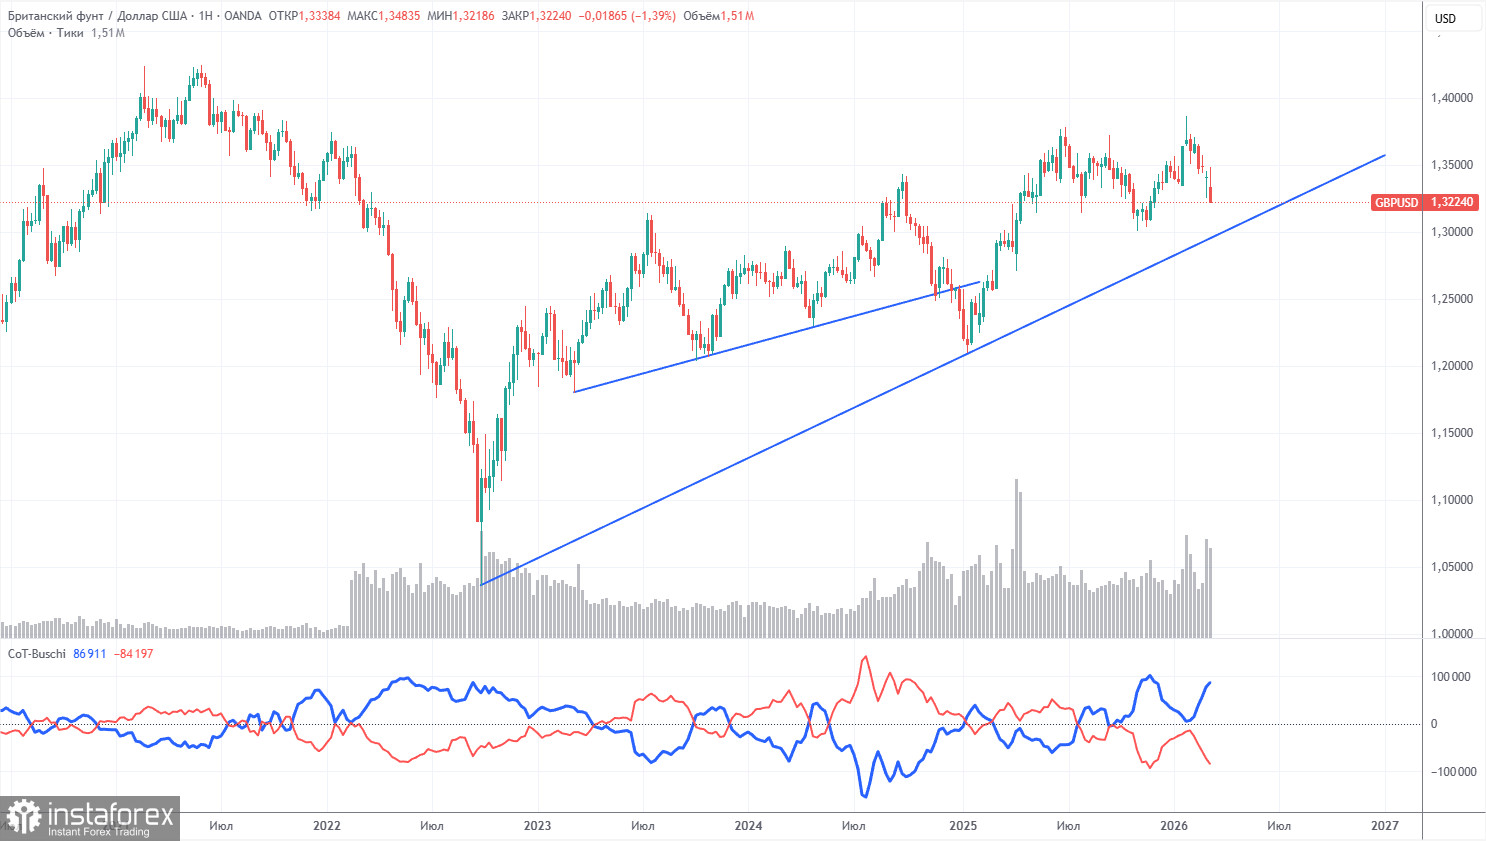
COT reports for the British pound show that, in recent years, sentiment among commercial traders has been constantly changing. The red and blue lines, which display the net positions of commercial and non-commercial traders, frequently cross and are mostly close to the zero mark. Currently, the lines are diverging, with non-commercial traders still dominating with... sales. However, considering the events in the Middle East, it is not surprising that demand for riskier currencies is falling while demand for the dollar is rising.
In the long run, the dollar continues to decline due to Donald Trump's policies, as shown on the weekly timeframe (illustration above). The trade war will continue in one form or another for a long time, and the Fed will, in any case, lower the rate within the next 12 months. Demand for the dollar will decline one way or another. However, currently, geopolitical factors are at the forefront, providing strong support for the US currency. According to the latest COT report (dated March 10) on the British pound, the "Non-commercial" group closed 10,200 BUY contracts and opened 1,200 SELL contracts. Thus, the net position of non-commercial traders decreased by another 11,400 contracts over the week.
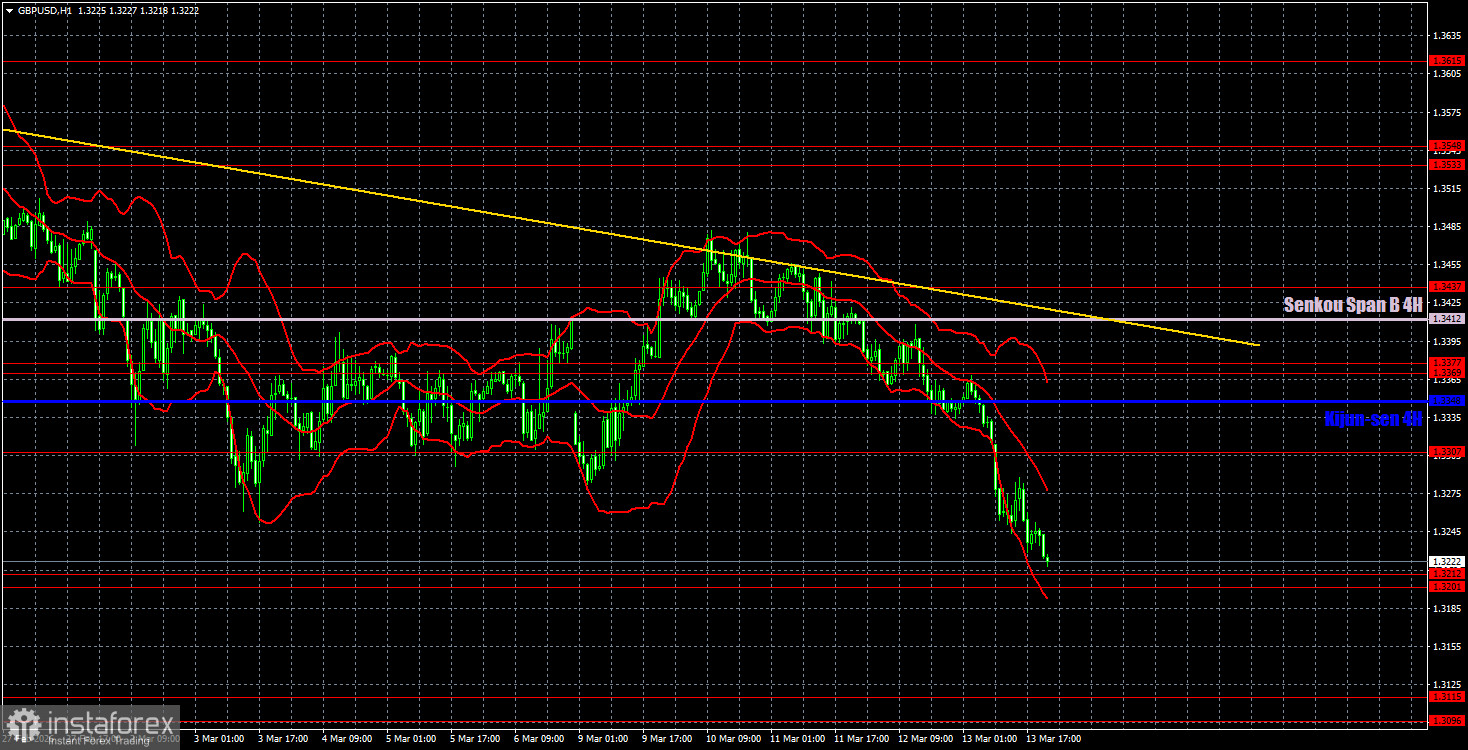
On the hourly timeframe, the GBP/USD pair could have transitioned to forming an upward trend long ago, but geopolitics continues to drag the British pound down. Despite the sharp decline of the pair in February-March, we still regard it as a correction. The daily timeframe confidently signals the preservation of an upward trend. Unfortunately, geopolitics is very unpredictable and can overshadow all other factors.
For March 16, we highlight the following important levels: 1.3096-1.3115, 1.3201-1.3212, 1.3307, 1.3369-1.3377, 1.3437, 1.3533-1.3548, 1.3615, 1.3671-1.3681, 1.3751-1.3763. The Senkou Span B (1.3412) and Kijun-sen (1.3348) lines may also serve as sources of signals. The Stop Loss level is recommended to be set to break even when the price moves in the right direction by 20 pips. The Ichimoku indicator lines may move throughout the day, which should be taken into account when determining trading signals.
There are no important macroeconomic reports or fundamental events scheduled for Friday in the UK and the US. Moreover, they are currently of no significance to traders. The pair's decline may continue even without news from the Middle East. Therefore, the best solution now is to follow the local downward trend.
Today, traders can open new short positions targeting 1.3096-1.3115 if the pair consolidates below the 1.3201-1.3212 range. Long positions will become relevant targeting the 1.3307 level if the price bounces from the 1.3201-1.3212 area.
Support and resistance price levels – thick red lines, around which movement may come to an end. They are not sources of trading signals.
Kijun-sen and Senkou Span B lines – Ichimoku indicator lines transferred to the hourly timeframe from the 4-hour timeframe. They are strong lines.
Extreme levels – thin red lines from which the price previously rebounded. They are sources of trading signals.
Yellow lines – trend lines, trend channels, and any other technical patterns.
Indicator 1 on COT charts – the size of the net position of each category of traders.
*এখানে পোস্ট করা মার্কেট বিশ্লেষণ আপনার সচেতনতা বৃদ্ধির জন্য প্রদান করা হয়, ট্রেড করার নির্দেশনা প্রদানের জন্য প্রদান করা হয় না।
ইন্সটাফরেক্স বিশ্লেষণমূলক পর্যালোচনাগুলো আপনাকে মার্কেট প্রবণতা সম্পর্কে পুরোপুরি সচেতন করবে! ইন্সটাফরেক্সের একজন গ্রাহক হওয়ায়, দক্ষ ট্রেডিং এর জন্য আপনাকে অনেক সেবা বিনামূল্যে প্রদান করা হয়।


