


GBP/USD
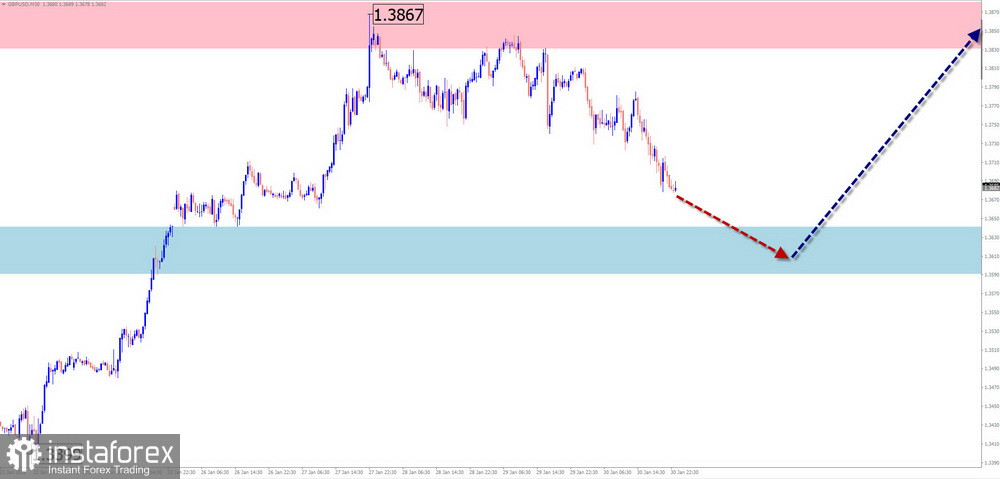
Within the bullish wave of the British pound chart that has been dominant since November of last year, a corrective wave that began last week is continuing. The structure of this wave segment does not appear complete at the time of analysis. Price is currently located at an intermediate large-scale potential reversal level.
During the upcoming week, continuation of the overall sideways movement is expected, within a price channel between opposing zones. After an attempt to pressure the support zone, a change in direction can be anticipated, followed by growth in the pound's price toward the calculated resistance zone. The highest activity is likely toward the end of next week.
Resistance:
Support:
Sell: Have limited potential and may be risky.Buy: Will become possible with a fractional position size after confirmed reversal signals appear near the support zone.
AUD/USD
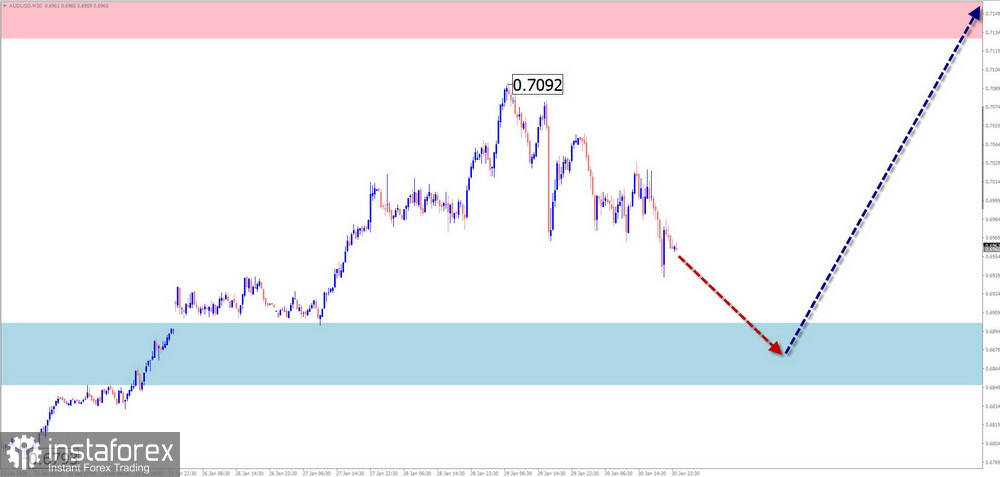
The currently unfinished bullish wave structure of the Australian dollar major pair dates back to spring of last year. Within the wave structure, the final wave segment (C) has been developing since November. Since last week, price has been pulling back downward, forming an expanded flat correction. Its structure is not complete at the time of analysis.
During the coming week, a price decline can be expected, with completion near the calculated support area. With high probability, the pair's price will then enter a sideways drift. A change in direction and resumption of price growth can be expected closer to the weekend.
Resistance:
Support:
Sell: Possible with fractional position sizes intraday, until the first reversal signals appear.Buy: Will become relevant only after appropriate signals from your trading system appear near the support zone.
USD/CHF
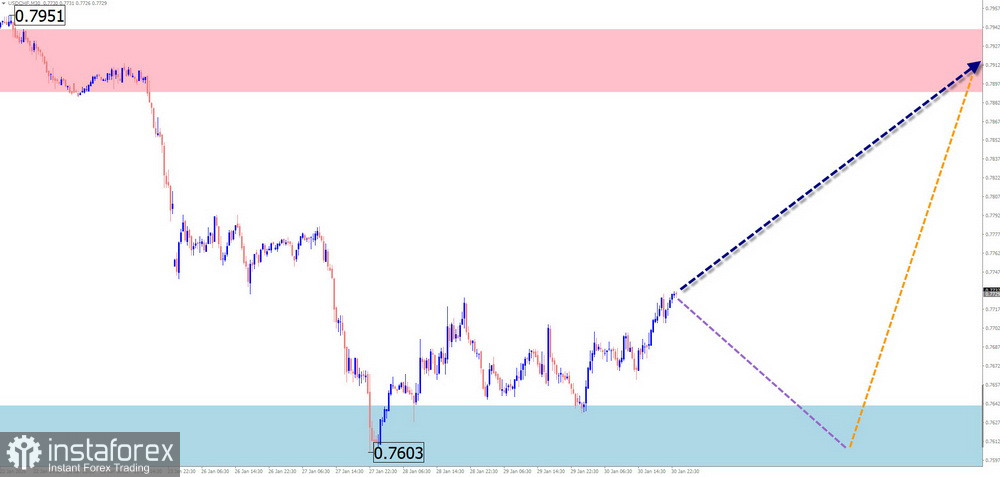
Since April of last year, quotes of the Swiss franc major have been forming an upward-sloping flat correction. The currently unfinished part of the movement is corrective and is pushing prices downward on the chart. One week ago, price reached the boundaries of a potential reversal zone. The upward segment that began on January 27 has reversal potential.
During the upcoming week, a change in the overall price movement bias is expected. After a possible decline toward the support zone, a resumption of the upward vector can be anticipated, with upside potential reaching the calculated resistance area. The timing of increased activity is most likely to coincide with the release of major news events.
Resistance:
Support:
Sell: Allowed with fractional position size during individual trading sessions.Buy: Will become safer after confirmed signals appear near the support zone on your trading system.
EUR/JPY
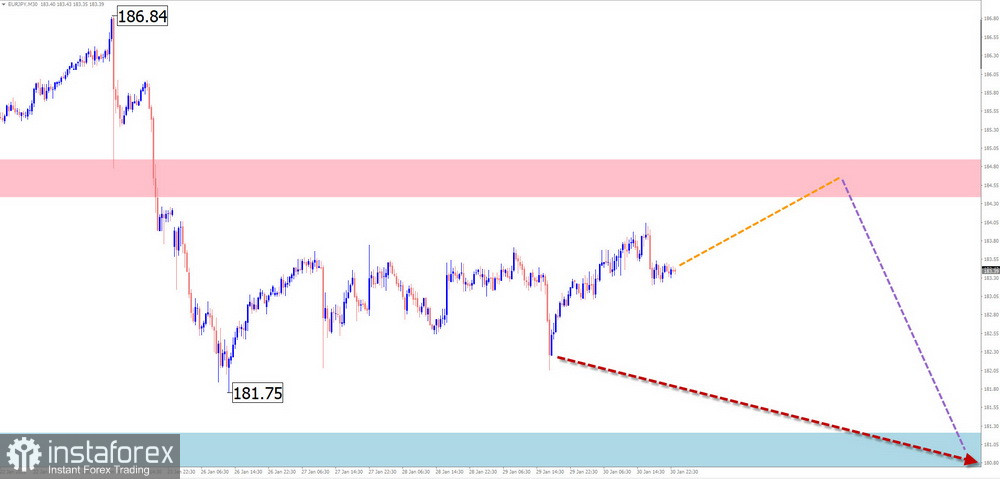
Analysis of the EUR/JPY pair chart indicates that a hidden correction within the wave structure dominant since February of last year is nearing completion. At the time of analysis, the wave structure appears formed. There are no signs of an imminent reversal on the chart. Calculated support runs along the upper boundary of the potential reversal zone.
During the coming week, continuation of the overall sideways price movement of the pair is expected. In the next few days, a short-term rise is possible, but not beyond the resistance zone. After that, a change in direction is highly likely. A decline within the weekly range is expected, but not below the calculated support zone.
Resistance:
Support:
Sell: Possible from the calculated resistance area during individual sessions. Reducing position size is safer.Buy: Will become relevant after appropriate signals appear in the support zone.
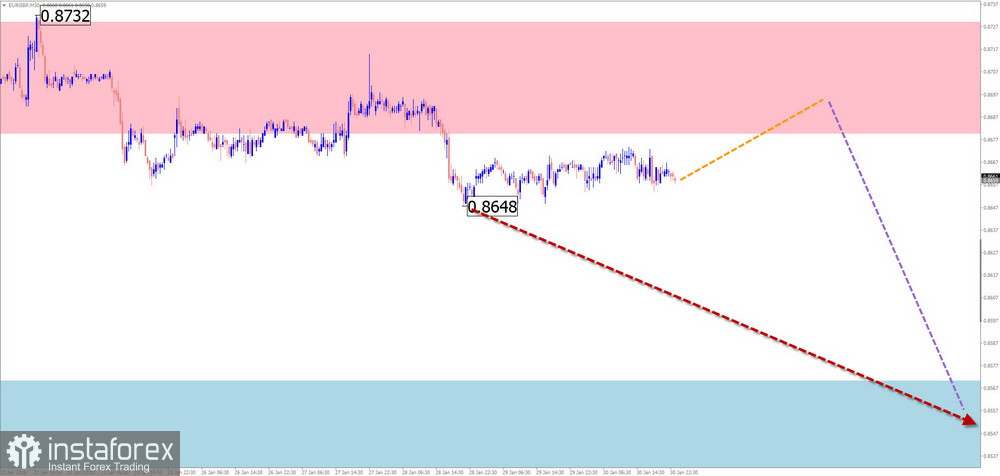
EUR/GBP
The direction of the EUR/GBP pair since April of last year has been defined by a downward wave algorithm. During the second half of last year, quotes moved in a sideways drift, forming an expanded corrective flat on the chart. The current segment began in late October, initiating the final part of the wave (C). The wave structure does not show completion.
At the beginning of the coming week, a flat bias can be expected along the boundaries of the calculated resistance. Sideways drift and formation of a reversal are then expected in this zone. A resumption of the pair's decline is likely closer to the weekend.
Resistance:
Support:
Sell: Will become possible after signals from your trading system appear near the resistance zone.Buy: Have no potential and are high risk.
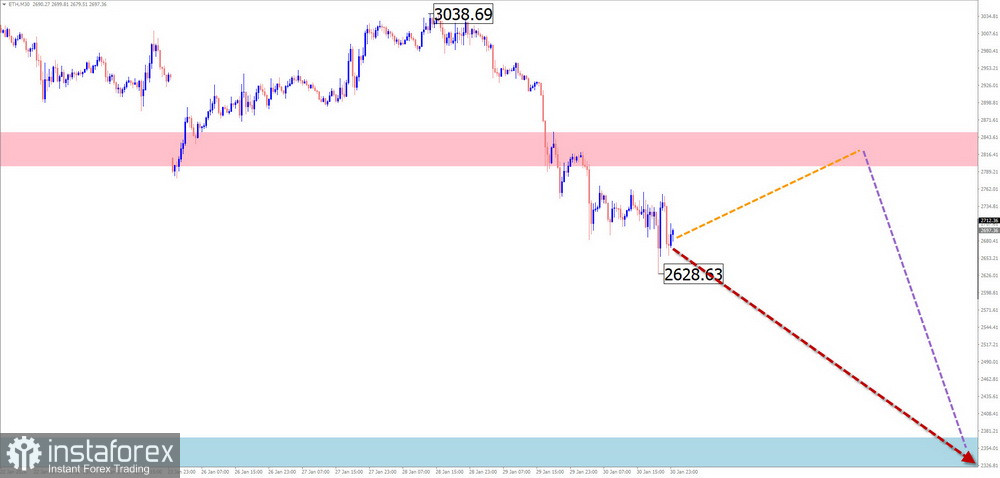
Ethereum
The direction of Ethereum's short-term trend is defined by a descending wave zigzag that began in the summer of last year. Since mid-November, the coin's quotes have been corrected. The structure of this wave segment does not show completion. Prices are moving within a narrow price channel between opposing reversal zones of different scales.
During the upcoming week, the most likely scenario is a continuation of price decline toward the support area. A preliminary bounce toward the resistance zone is possible. In the second half of the week, the probability of increased volatility rises. A breakout beyond the calculated zones during the coming week is unlikely.
Resistance:
Support:
Sell: Possible from the resistance zone during individual sessions. Reducing position size is advisable.Buy: Not relevant until appropriate signals appear near the calculated support area.
Notes:
In simplified wave analysis (SWA), all waves consist of three parts (A–B–C). On each timeframe, the most recent unfinished wave is analyzed. Dotted lines indicate expected movements.
Attention: The wave algorithm does not account for the duration of price movements over time.
*এখানে পোস্ট করা মার্কেট বিশ্লেষণ আপনার সচেতনতা বৃদ্ধির জন্য প্রদান করা হয়, ট্রেড করার নির্দেশনা প্রদানের জন্য প্রদান করা হয় না।
ইন্সটাফরেক্স বিশ্লেষণমূলক পর্যালোচনাগুলো আপনাকে মার্কেট প্রবণতা সম্পর্কে পুরোপুরি সচেতন করবে! ইন্সটাফরেক্সের একজন গ্রাহক হওয়ায়, দক্ষ ট্রেডিং এর জন্য আপনাকে অনেক সেবা বিনামূল্যে প্রদান করা হয়।


