


The legend in the InstaSpot team!
Legend! You think that's bombastic rhetoric? But how should we call a man, who became the first Asian to win the junior world chess championship at 18 and who became the first Indian Grandmaster at 19? That was the start of a hard path to the World Champion title for Viswanathan Anand, the man who became a part of history of chess forever. Now one more legend in the InstaSpot team!


Borussia is one of the most titled football clubs in Germany, which has repeatedly proved to fans: the spirit of competition and leadership will certainly lead to success. Trade in the same way that sports professionals play the game: confidently and actively. Keep a "pass" from Borussia FC and be in the lead with InstaSpot!

This week, the market may start moving downward from the 1.1742 level (the close of the last weekly candle) with a target at 1.1536 – the 38.2% retracement level (blue dashed line). Upon testing this level, the price may begin an upward movement targeting 1.1571 – the upper fractal (red dashed line).
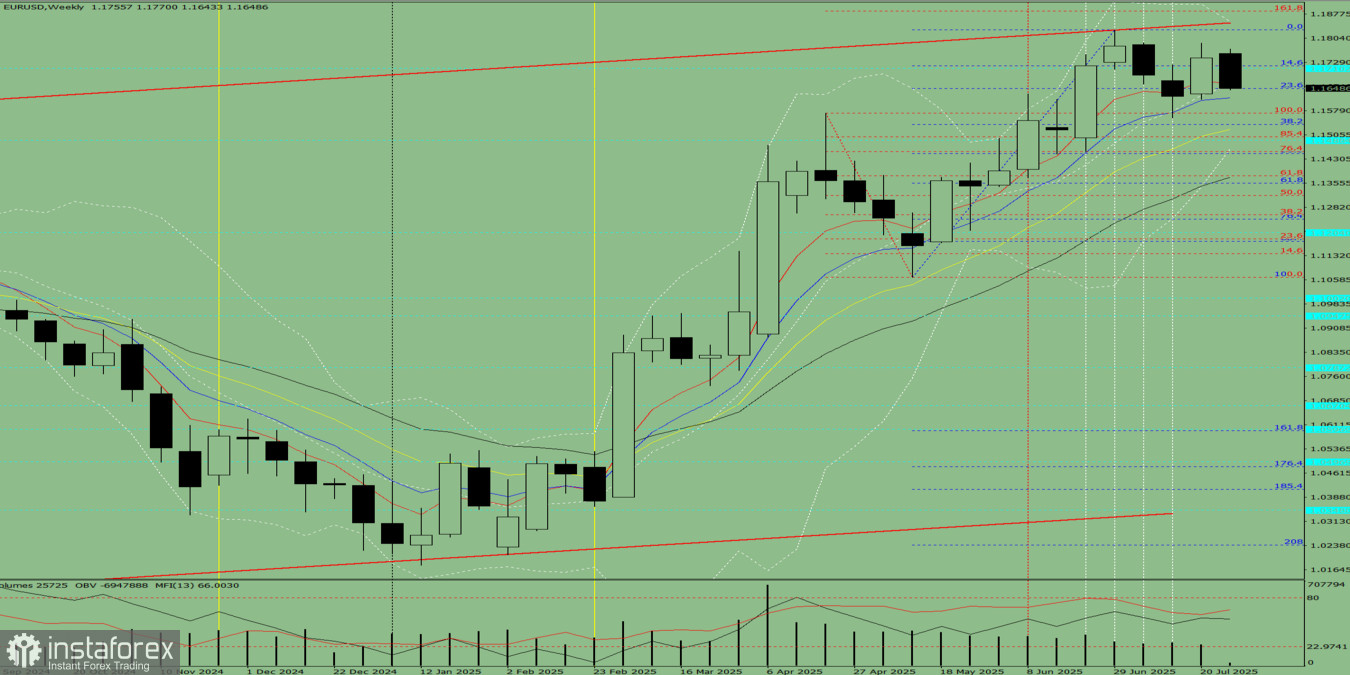
Figure 1 (Weekly Chart)
Conclusion from the Comprehensive Analysis: downward movement.
The price is most likely to show a downward trend throughout the week, with the weekly black candle lacking an upper shadow (Monday – down), and forming a lower shadow (Friday – up).
The pair may begin moving downward from the 1.1742 level (close of the last weekly candle) toward the target of 1.1498 – the 85.4% retracement level (red dashed line). Upon testing this level, the price may start an upward movement targeting 1.1571 – the upper fractal (red dashed line).
*এখানে পোস্ট করা মার্কেট বিশ্লেষণ আপনার সচেতনতা বৃদ্ধির জন্য প্রদান করা হয়, ট্রেড করার নির্দেশনা প্রদানের জন্য প্রদান করা হয় না।
ইন্সটাফরেক্স বিশ্লেষণমূলক পর্যালোচনাগুলো আপনাকে মার্কেট প্রবণতা সম্পর্কে পুরোপুরি সচেতন করবে! ইন্সটাফরেক্সের একজন গ্রাহক হওয়ায়, দক্ষ ট্রেডিং এর জন্য আপনাকে অনেক সেবা বিনামূল্যে প্রদান করা হয়।


