




Our team has over 7,000,000 traders!
Every day we work together to improve trading. We get high results and move forward.
Recognition by millions of traders all over the world is the best appreciation of our work! You made your choice and we will do everything it takes to meet your expectations!
We are a great team together!
InstaSpot. Proud to work for you!





Actor, UFC 6 tournament champion and a true hero!
The man who made himself. The man that goes our way.
The secret behind Taktarov's success is constant movement towards the goal.
Reveal all the sides of your talent!
Discover, try, fail - but never stop!
InstaSpot. Your success story starts here!

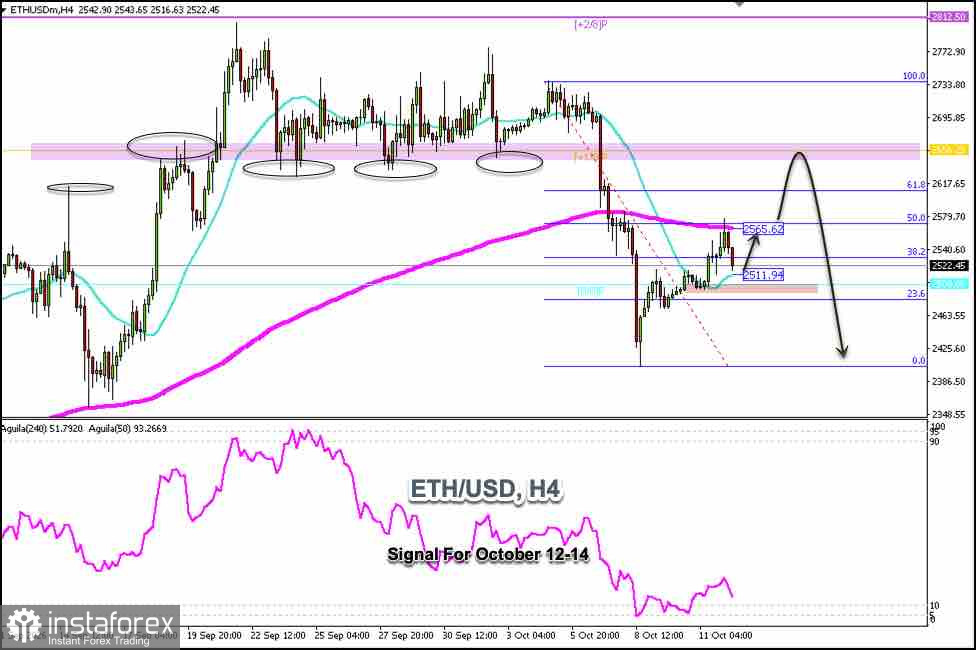
ETH/USD is trading around $2,522, pulling back after reaching the 200 EMA—a level that coincided with the 50% Fibonacci retracement. ETH experienced a sharp decline from a high of 2,735 to a low of $2,400.
ETH could continue to fall in the coming days, reaching the $2,400 zone, and might even hit the September 14 low of around $2,370.
If Ether settles below the 8/8 Murray level in the coming hours, bearish pressure could continue in the coming days, and we could expect Ether to continue falling.
Conversely, if Ether consolidates above the 8/8 Murray line and above the psychological level of $2,500, we could view this area as a buying opportunity, with targets at the 200 EMA around $2,565; the next target could be the 61.8% Fibonacci retracement level around $2,614, and finally, we expect it to reach the strong resistance level that previously acted as support above $2,656.
A consolidation above the 200 EMA around $2,565 will be a bullish signal, and we could continue buying. We expect ETH to reach $2,700 and even $2,812 in the coming days.
Below $2,500, bearish pressure could continue over the next few days.
*এখানে পোস্ট করা মার্কেট বিশ্লেষণ আপনার সচেতনতা বৃদ্ধির জন্য প্রদান করা হয়, ট্রেড করার নির্দেশনা প্রদানের জন্য প্রদান করা হয় না।
ইন্সটাফরেক্স বিশ্লেষণমূলক পর্যালোচনাগুলো আপনাকে মার্কেট প্রবণতা সম্পর্কে পুরোপুরি সচেতন করবে! ইন্সটাফরেক্সের একজন গ্রাহক হওয়ায়, দক্ষ ট্রেডিং এর জন্য আপনাকে অনেক সেবা বিনামূল্যে প্রদান করা হয়।


