




Our team has over 7,000,000 traders!
Every day we work together to improve trading. We get high results and move forward.
Recognition by millions of traders all over the world is the best appreciation of our work! You made your choice and we will do everything it takes to meet your expectations!
We are a great team together!
InstaSpot. Proud to work for you!





Actor, UFC 6 tournament champion and a true hero!
The man who made himself. The man that goes our way.
The secret behind Taktarov's success is constant movement towards the goal.
Reveal all the sides of your talent!
Discover, try, fail - but never stop!
InstaSpot. Your success story starts here!

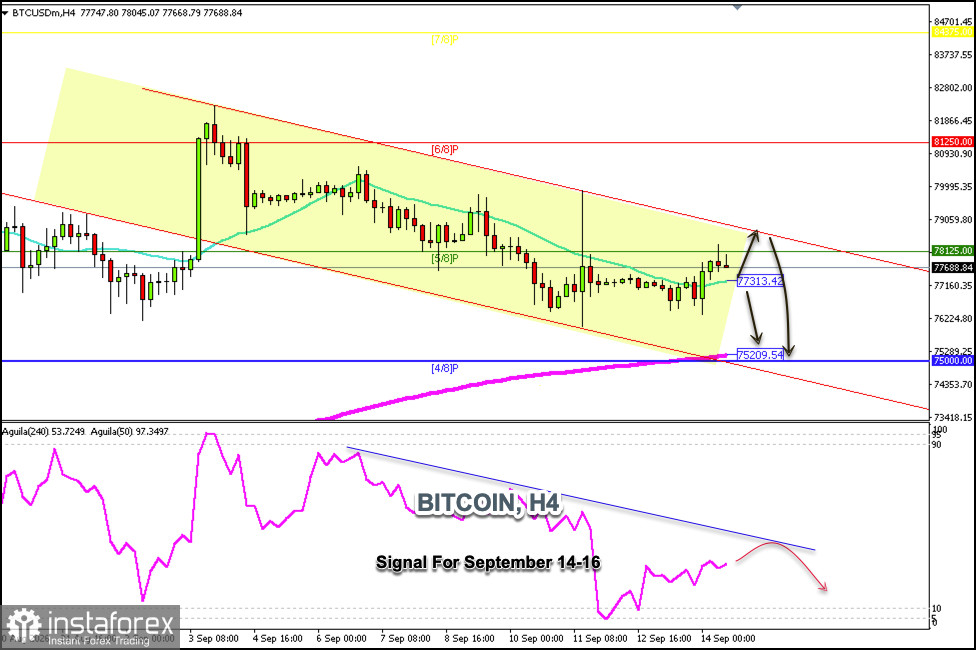
Bitcoin is trading around $77,688, below the 5/8 Murray level and within a downtrend channel that has been forming since early September. Bitcoin could continue to fall in the coming days and reach the 4/8 Murray level around $75,000.
A technical bounce is expected around $77,313. If the instrument consolidates above this zone, it could be seen as an opportunity to open long positions in anticipation of a decisive breakout above the uptrend channel around $78,900, after which BTC could climb to the 6/8 Murray level around $81,250.
A pullback toward the $78,900 zone—where the price coincides with the top of the downtrend channel—could be seen as a signal to sell, in anticipation of the price reaching the 200 EMA around $75,209 in the coming days.
Technically, Bitcoin is in an oversold zone, so we believe it could continue to rise in the coming hours; however, we must remain cautious as the downtrend could resume.
A good idea for opening long positions would be to wait for Bitcoin to reach $75,000, as this zone coincides with the 200 EMA, the lower band of the downtrend channel, and the 4/8 Murray level, which represents solid support.
*এখানে পোস্ট করা মার্কেট বিশ্লেষণ আপনার সচেতনতা বৃদ্ধির জন্য প্রদান করা হয়, ট্রেড করার নির্দেশনা প্রদানের জন্য প্রদান করা হয় না।
ইন্সটাফরেক্স বিশ্লেষণমূলক পর্যালোচনাগুলো আপনাকে মার্কেট প্রবণতা সম্পর্কে পুরোপুরি সচেতন করবে! ইন্সটাফরেক্সের একজন গ্রাহক হওয়ায়, দক্ষ ট্রেডিং এর জন্য আপনাকে অনেক সেবা বিনামূল্যে প্রদান করা হয়।


