




Our team has over 7,000,000 traders!
Every day we work together to improve trading. We get high results and move forward.
Recognition by millions of traders all over the world is the best appreciation of our work! You made your choice and we will do everything it takes to meet your expectations!
We are a great team together!
InstaSpot. Proud to work for you!





Actor, UFC 6 tournament champion and a true hero!
The man who made himself. The man that goes our way.
The secret behind Taktarov's success is constant movement towards the goal.
Reveal all the sides of your talent!
Discover, try, fail - but never stop!
InstaSpot. Your success story starts here!

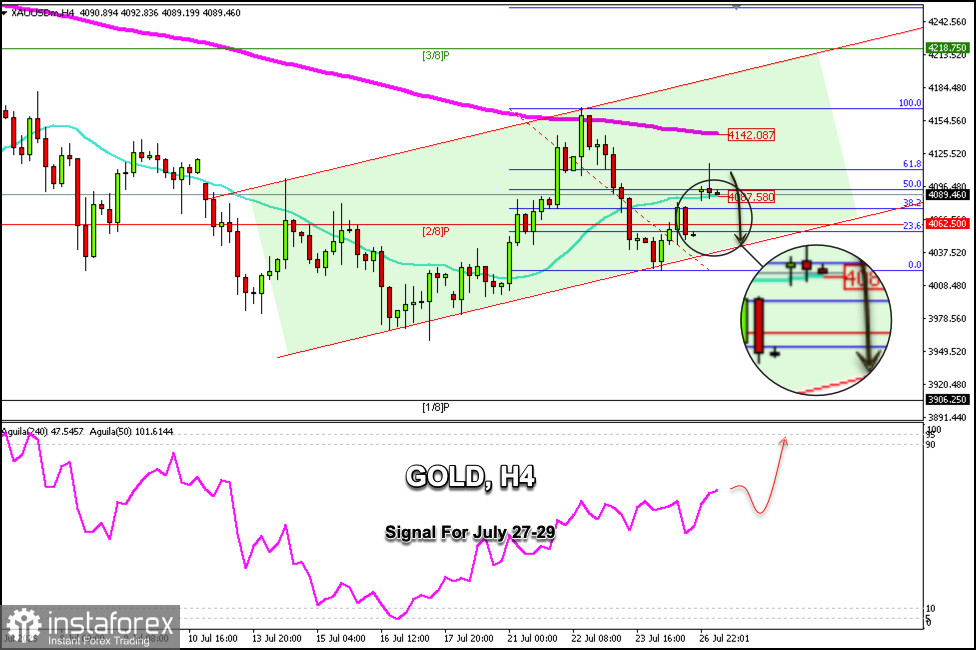
Gold is trading around $4,089 after reaching the 61.8% Fibonacci level around $4,117 and is now pulling back. On the H4 chart, we can see that gold left a gap around the $4,052 level, which is below the Murray 2/8 level. This suggests that gold is likely to continue falling in the coming days.
If, in the coming hours, gold falls below $4,087—where the 21 SMA is located—this could be interpreted as a bearish sell signal, with targets at the 2/8 Murray level, around $4,062. Ultimately, we expect it to close the gap and reach the lower band of the uptrend channel, around $4,040.
Since the trend for gold remains bullish, as indicated by the Eagle indicator, we could look for buying opportunities if the price consolidates above $4,080. Alternatively, a bounce around the 2/8 Murray level could be considered an opportunity to open long positions, with targets at the 200 EMA level, around $4,142.
If the downtrend continues and the price consolidates below the 61.8% Fibonacci level, we could expect it to reach the psychological level of $4,000 in the coming days and eventually reach the Murray 1/8 level, around $3,906.
*এখানে পোস্ট করা মার্কেট বিশ্লেষণ আপনার সচেতনতা বৃদ্ধির জন্য প্রদান করা হয়, ট্রেড করার নির্দেশনা প্রদানের জন্য প্রদান করা হয় না।
ইন্সটাফরেক্স বিশ্লেষণমূলক পর্যালোচনাগুলো আপনাকে মার্কেট প্রবণতা সম্পর্কে পুরোপুরি সচেতন করবে! ইন্সটাফরেক্সের একজন গ্রাহক হওয়ায়, দক্ষ ট্রেডিং এর জন্য আপনাকে অনেক সেবা বিনামূল্যে প্রদান করা হয়।


