


The legend in the InstaSpot team!
Legend! You think that's bombastic rhetoric? But how should we call a man, who became the first Asian to win the junior world chess championship at 18 and who became the first Indian Grandmaster at 19? That was the start of a hard path to the World Champion title for Viswanathan Anand, the man who became a part of history of chess forever. Now one more legend in the InstaSpot team!


Borussia is one of the most titled football clubs in Germany, which has repeatedly proved to fans: the spirit of competition and leadership will certainly lead to success. Trade in the same way that sports professionals play the game: confidently and actively. Keep a "pass" from Borussia FC and be in the lead with InstaSpot!

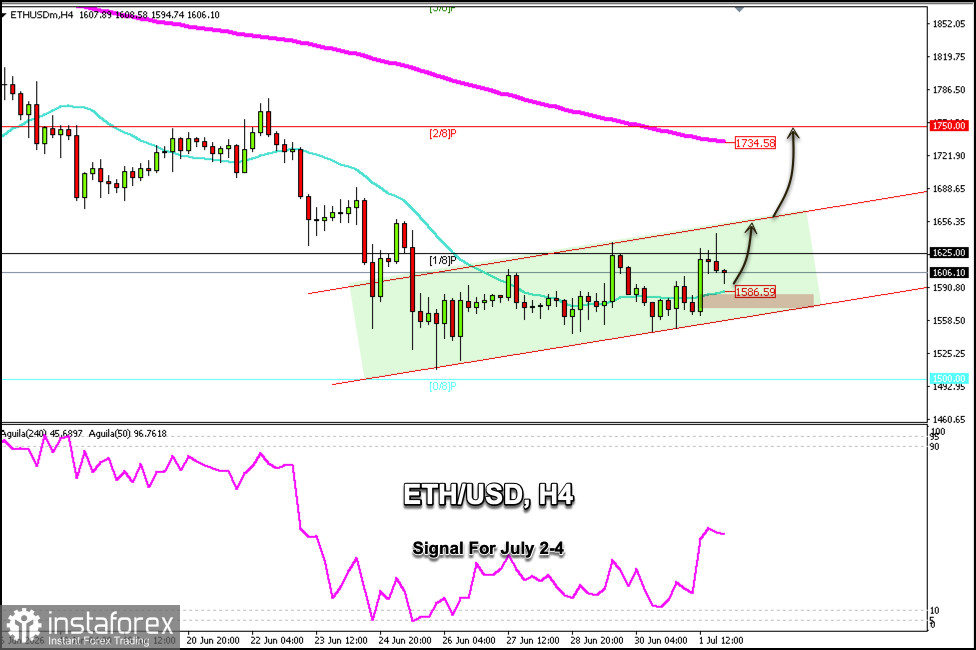
ETHEREUM (ETH) is trading around $1,606 and is pulling back after reaching a high of $1,650 during Wednesday's US trading session. Technically, this pullback could be seen as an opportunity to re-enter long positions.
According to the H4 chart, we can see that Ethereum has been trading within an uptrend channel formed since June 26. If it consolidates above $1,586 in the coming hours, the outlook is likely to be positive, and we could expect it to reach the upper band of the uptrend channel around $1,670.
Conversely, if bearish pressure prevails, Etherum is expected to find strong support near the lower band of the uptrend channel, around $1,560.
The Eagle indicator is showing a positive signal, so this pullback could be considered a 38.2% Fibonacci retracement zone. If Ethereum reaches the 61.8% level around $1,580, it could be seen as a buying opportunity in the coming hours.
A decisive break above $1,680 could drive ETH/USD toward the 200 EMA, reaching around $1,735, and it could ultimately hit the strong resistance at $1,750.
*এখানে পোস্ট করা মার্কেট বিশ্লেষণ আপনার সচেতনতা বৃদ্ধির জন্য প্রদান করা হয়, ট্রেড করার নির্দেশনা প্রদানের জন্য প্রদান করা হয় না।
ইন্সটাফরেক্স বিশ্লেষণমূলক পর্যালোচনাগুলো আপনাকে মার্কেট প্রবণতা সম্পর্কে পুরোপুরি সচেতন করবে! ইন্সটাফরেক্সের একজন গ্রাহক হওয়ায়, দক্ষ ট্রেডিং এর জন্য আপনাকে অনেক সেবা বিনামূল্যে প্রদান করা হয়।


