


The legend in the InstaSpot team!
Legend! You think that's bombastic rhetoric? But how should we call a man, who became the first Asian to win the junior world chess championship at 18 and who became the first Indian Grandmaster at 19? That was the start of a hard path to the World Champion title for Viswanathan Anand, the man who became a part of history of chess forever. Now one more legend in the InstaSpot team!


Borussia is one of the most titled football clubs in Germany, which has repeatedly proved to fans: the spirit of competition and leadership will certainly lead to success. Trade in the same way that sports professionals play the game: confidently and actively. Keep a "pass" from Borussia FC and be in the lead with InstaSpot!

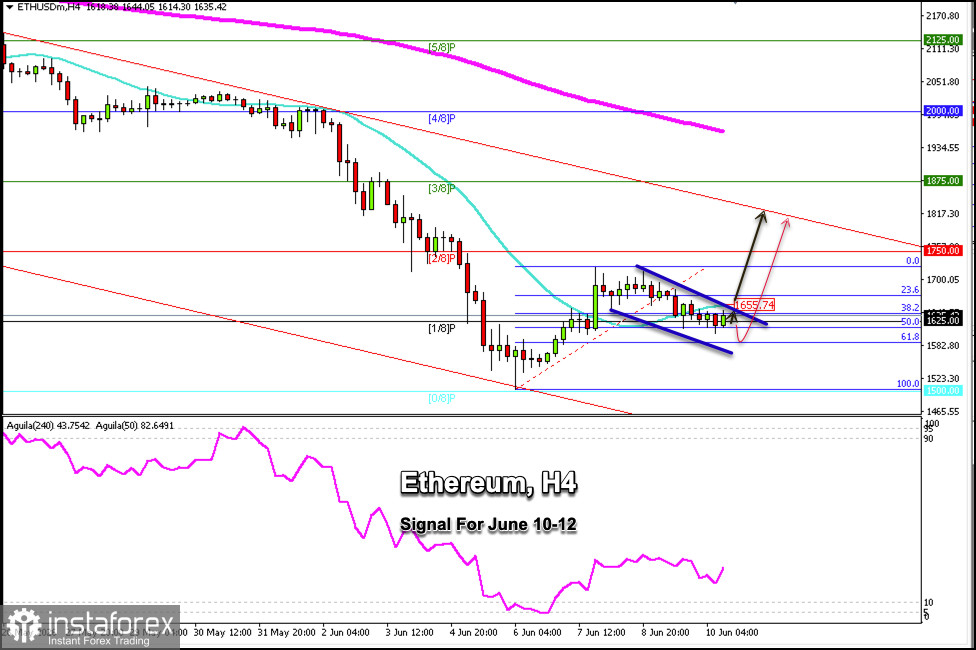
Ethereum (ETH/USD) is trading around $1,635, bouncing after reaching the 50% Fibonacci retracement level drawn from its low of $1,500 to its high of $1,725. Ethereum may struggle to continue its upward trend, and we could expect a further downward movement in the coming days, potentially reaching the 61.8% Fibonacci level around $1,590.
Given the prevailing bearish pressure, Ethereum is expected to return to the $1,500 level, a key level that could be seen as a decisive point for entering long positions. Alternatively, if the ETH price breaks above the 61.8% Fibonacci level, it could be viewed as a bullish signal.
Conversely, if Ethereum consolidates above the 21-period SMA at $1,655 in the coming hours, we could expect the bullish cycle to resume, potentially reaching the 2/8 Murray level around $1,750 and even the upper band of the descending trend channel around $1,785.
Ethereum could recover some of its losses if it consolidates above $1,650 in the coming days, potentially reaching the 200-period EMA around $1,925. Given that all cryptocurrencies are currently under bearish pressure, we could look for opportunities to sell below $1,655, with targets at $1,580 and ultimately around the 0/8 Murray level at $1,500.
*এখানে পোস্ট করা মার্কেট বিশ্লেষণ আপনার সচেতনতা বৃদ্ধির জন্য প্রদান করা হয়, ট্রেড করার নির্দেশনা প্রদানের জন্য প্রদান করা হয় না।
ইন্সটাফরেক্স বিশ্লেষণমূলক পর্যালোচনাগুলো আপনাকে মার্কেট প্রবণতা সম্পর্কে পুরোপুরি সচেতন করবে! ইন্সটাফরেক্সের একজন গ্রাহক হওয়ায়, দক্ষ ট্রেডিং এর জন্য আপনাকে অনেক সেবা বিনামূল্যে প্রদান করা হয়।


