


The legend in the InstaSpot team!
Legend! You think that's bombastic rhetoric? But how should we call a man, who became the first Asian to win the junior world chess championship at 18 and who became the first Indian Grandmaster at 19? That was the start of a hard path to the World Champion title for Viswanathan Anand, the man who became a part of history of chess forever. Now one more legend in the InstaSpot team!


Borussia is one of the most titled football clubs in Germany, which has repeatedly proved to fans: the spirit of competition and leadership will certainly lead to success. Trade in the same way that sports professionals play the game: confidently and actively. Keep a "pass" from Borussia FC and be in the lead with InstaSpot!

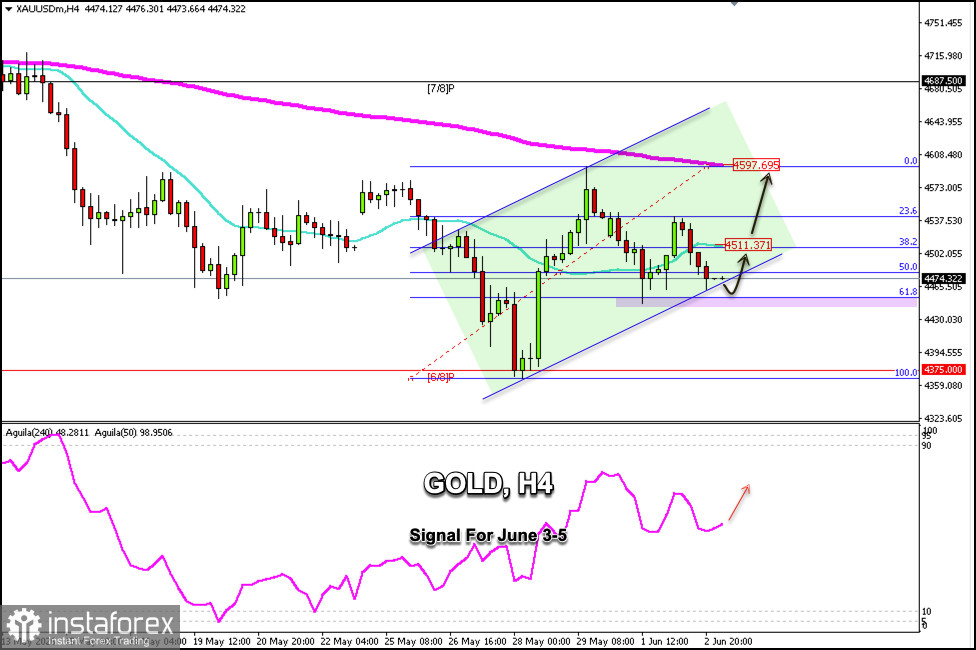
Gold is trading around $4,474, reaching the 61.8% Fibonacci retracement level drawn from the low of 4,365 to the high of 4,595.
If gold consolidates above $4,460 in the coming hours and above the 61.8% Fibonacci area, it could be seen as a buying opportunity with targets at the 21 SMA around $4,511.
Even a decisive break above the 38.2% Fibonacci level could prompt gold to continue its uptrend, potentially reaching the 200 EMA at around $4,597.
Conversely, if gold falls below $4,460, the downtrend could be confirmed, and we can expect a retest of the key 6/8 Murray support around $4,375.
Gold is under downward pressure. So, if a pullback occurs toward $4,511 or $4,597, its bearish cycle could resume, with prices expected to reach $4,375 in the short term.
The Eagle indicator is showing a positive signal, but XAU/USD may struggle to continue rising as it is under downward pressure; only a decisive break above $4,600 in the coming days could trigger a new bullish sequence, in which case we could expect the instrument to reach $4,750.
*এখানে পোস্ট করা মার্কেট বিশ্লেষণ আপনার সচেতনতা বৃদ্ধির জন্য প্রদান করা হয়, ট্রেড করার নির্দেশনা প্রদানের জন্য প্রদান করা হয় না।
ইন্সটাফরেক্স বিশ্লেষণমূলক পর্যালোচনাগুলো আপনাকে মার্কেট প্রবণতা সম্পর্কে পুরোপুরি সচেতন করবে! ইন্সটাফরেক্সের একজন গ্রাহক হওয়ায়, দক্ষ ট্রেডিং এর জন্য আপনাকে অনেক সেবা বিনামূল্যে প্রদান করা হয়।


