


The legend in the InstaSpot team!
Legend! You think that's bombastic rhetoric? But how should we call a man, who became the first Asian to win the junior world chess championship at 18 and who became the first Indian Grandmaster at 19? That was the start of a hard path to the World Champion title for Viswanathan Anand, the man who became a part of history of chess forever. Now one more legend in the InstaSpot team!


Borussia is one of the most titled football clubs in Germany, which has repeatedly proved to fans: the spirit of competition and leadership will certainly lead to success. Trade in the same way that sports professionals play the game: confidently and actively. Keep a "pass" from Borussia FC and be in the lead with InstaSpot!

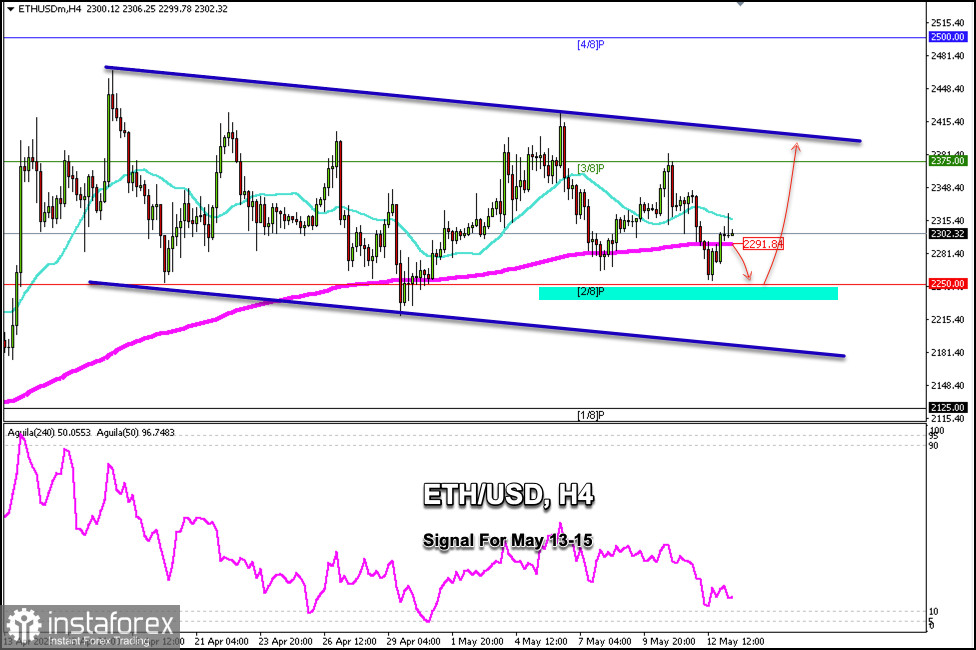
ETH/USD is trading around $2,303, above the 21-day SMA and the 200-day EMA, showing a technical rebound but also signs of exhaustion. ETH is trading within a range of $2,435 to $2,200.
According to the H4 chart, we can see that Ethereum is within a bearish trend channel formed since April 15. If the price falls below $2,300, it could continue its downward movement until it finds the 2/8 Murray support around $2,250.
The 2/8 Murray support level could provide a good technical bounce for ETH/USD and could be seen as an opportunity to open long positions with targets at $2,291 and $2,375.
A sharp drop below $2,250 could extend the decline to the lower band of the bearish trend channel around $2,180, and the instrument could even reach the 1/8 Murray line around $2,125.
Our trading plan for the coming hours is to sell Ethereum below $2,300 toward the 6/8 Murray level and buy above the 6/8 Murray level with targets toward the 21 SMA.
*এখানে পোস্ট করা মার্কেট বিশ্লেষণ আপনার সচেতনতা বৃদ্ধির জন্য প্রদান করা হয়, ট্রেড করার নির্দেশনা প্রদানের জন্য প্রদান করা হয় না।
ইন্সটাফরেক্স বিশ্লেষণমূলক পর্যালোচনাগুলো আপনাকে মার্কেট প্রবণতা সম্পর্কে পুরোপুরি সচেতন করবে! ইন্সটাফরেক্সের একজন গ্রাহক হওয়ায়, দক্ষ ট্রেডিং এর জন্য আপনাকে অনেক সেবা বিনামূল্যে প্রদান করা হয়।


