


The legend in the InstaSpot team!
Legend! You think that's bombastic rhetoric? But how should we call a man, who became the first Asian to win the junior world chess championship at 18 and who became the first Indian Grandmaster at 19? That was the start of a hard path to the World Champion title for Viswanathan Anand, the man who became a part of history of chess forever. Now one more legend in the InstaSpot team!


Borussia is one of the most titled football clubs in Germany, which has repeatedly proved to fans: the spirit of competition and leadership will certainly lead to success. Trade in the same way that sports professionals play the game: confidently and actively. Keep a "pass" from Borussia FC and be in the lead with InstaSpot!

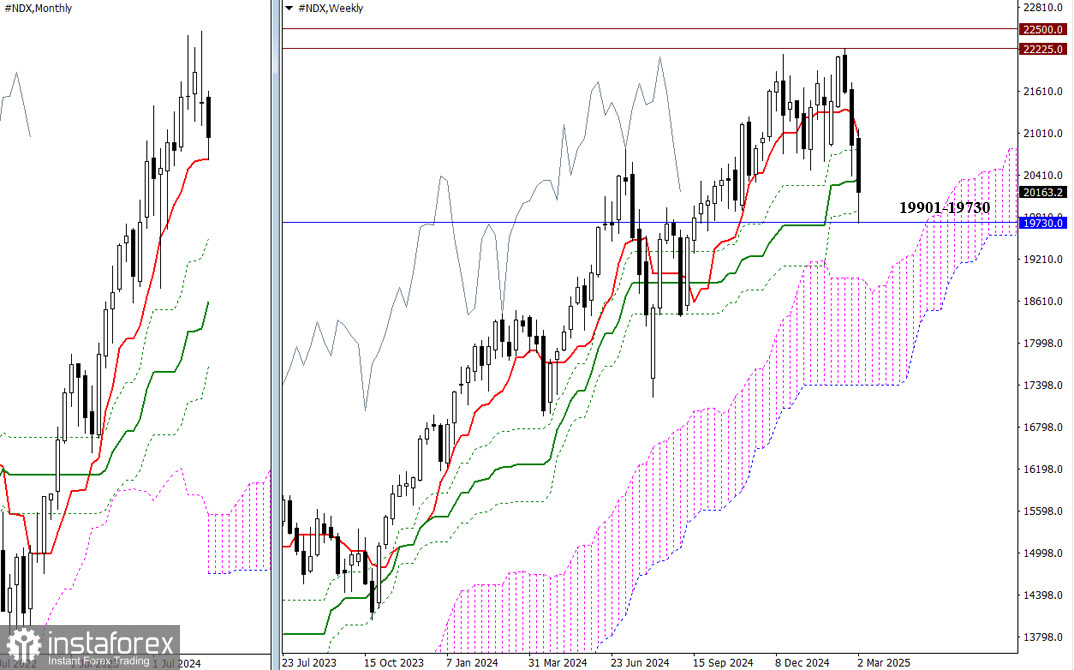
March is developing a corrective bearish decline. Over the past trading week, two key levels—19901 and 19730—were tested, which correspond to the final level of the weekly Ichimoku cross and the monthly short-term trend. A breakout of these levels could open up further downside potential for sellers, with the next major support located around 18891, marking the upper boundary of the weekly Ichimoku cloud. If the market rebounds, it might lead to a retest of the previously broken weekly golden cross levels at 20345, 20789, and 20973.
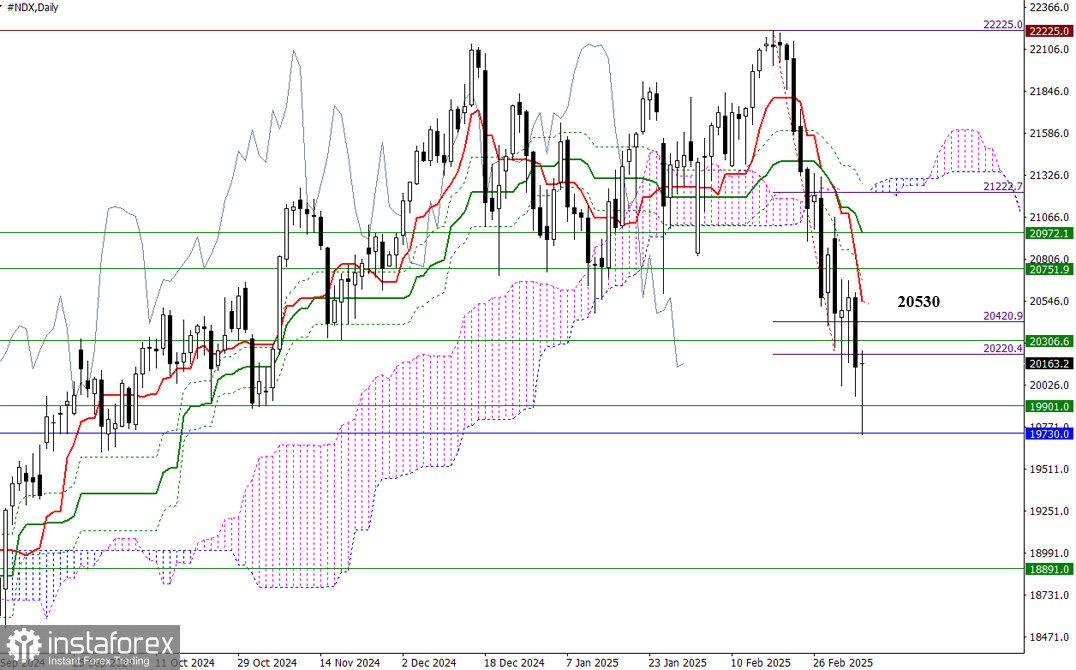
On the daily timeframe, the target for breaking through the daily Ichimoku cloud at 20220 has been fully achieved. A rebound has already started after testing deeper supports at 19901 and 19730. If buyers manage to confirm and extend this rebound, a restoration of bullish positions may involve a corrective rally toward the daily Ichimoku cross levels. The nearest resistance for buyers currently lies at the daily short-term trend around 20530.
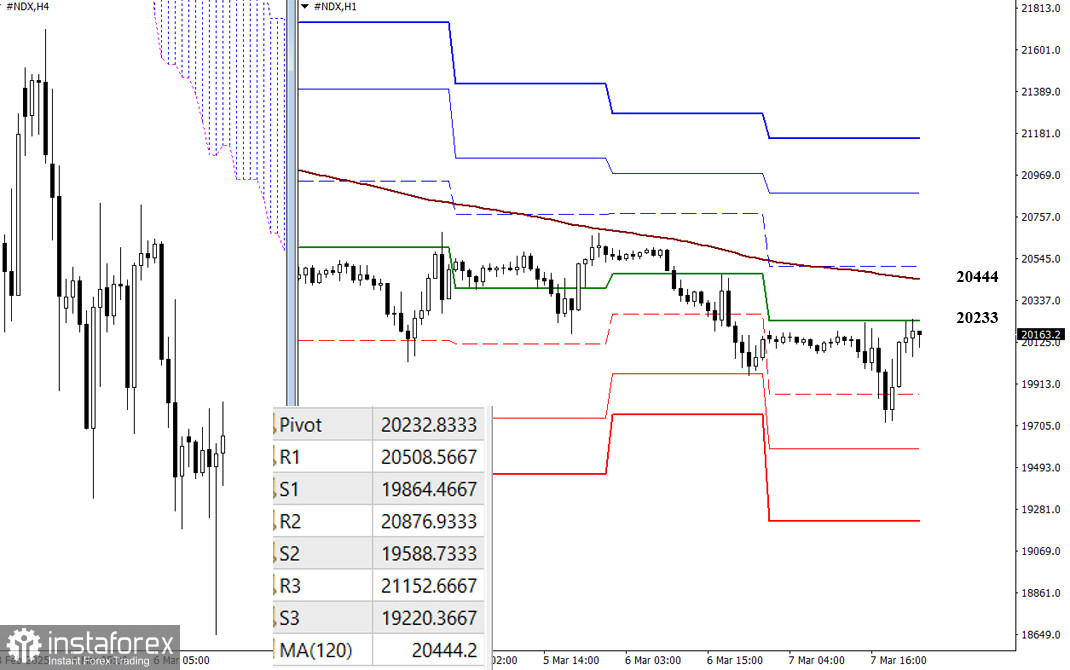
On lower timeframes, sellers maintain a dominant position and continue developing the downward trend. However, during corrective rallies, key levels are repeatedly tested. At this moment, the market is consolidating around the central pivot level of the day at 20233, with the weekly long-term trend resistance just above at 20444. A breakout and trend reversal at these levels could shift the balance of power. As seen on higher timeframes, classic pivot levels act as additional intraday references that update daily, with fresh levels appearing at the market open after the weekend.
***
*এখানে পোস্ট করা মার্কেট বিশ্লেষণ আপনার সচেতনতা বৃদ্ধির জন্য প্রদান করা হয়, ট্রেড করার নির্দেশনা প্রদানের জন্য প্রদান করা হয় না।
ইন্সটাফরেক্স বিশ্লেষণমূলক পর্যালোচনাগুলো আপনাকে মার্কেট প্রবণতা সম্পর্কে পুরোপুরি সচেতন করবে! ইন্সটাফরেক্সের একজন গ্রাহক হওয়ায়, দক্ষ ট্রেডিং এর জন্য আপনাকে অনেক সেবা বিনামূল্যে প্রদান করা হয়।


