


The legend in the InstaSpot team!
Legend! You think that's bombastic rhetoric? But how should we call a man, who became the first Asian to win the junior world chess championship at 18 and who became the first Indian Grandmaster at 19? That was the start of a hard path to the World Champion title for Viswanathan Anand, the man who became a part of history of chess forever. Now one more legend in the InstaSpot team!


Borussia is one of the most titled football clubs in Germany, which has repeatedly proved to fans: the spirit of competition and leadership will certainly lead to success. Trade in the same way that sports professionals play the game: confidently and actively. Keep a "pass" from Borussia FC and be in the lead with InstaSpot!

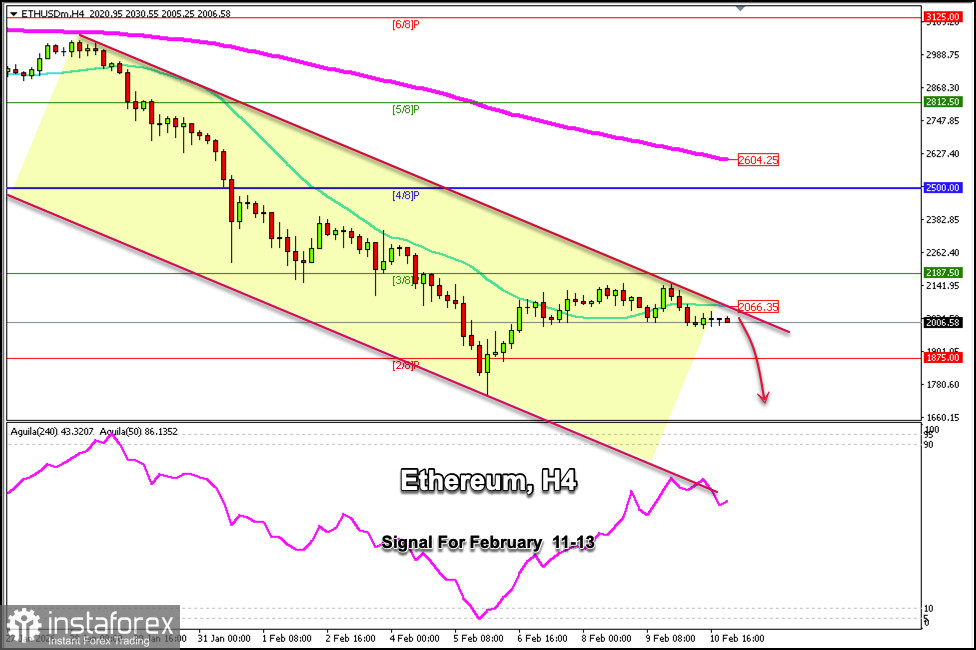
Ethereum (ETH/USD) is trading around $2,006 below the 21 SMA within the downtrend channel formed since January 28 under bearish pressure.
The H4 chart shows that Ethereum is consolidating around the psychological level of $2,000, which means that in the coming days, the instrument could make a bearish movement towards the 2/8 Murray located at $1,875. ETH could even plunge to the 1/8 Murray around $1,515.
If Ethereum recovers some of its losses, we could expect it to consolidate above the 21 EMA located around $2,006 and then continue its upward bias and reach the 3/8 Murray at $2,187. Finally, it could reach the 4/8 Murray around $2,500.
The key idea to sell ETH/USD in the coming hours is to watch the price move within the downtrend channel. In this case, we could expect the target of $1,875 or the February 5 low around $1,718.
The Eagle indicator is showing a neutral signal, so we should wait for confirmation to buy above $2,100 or continue with our selling strategy below $2,000.
*এখানে পোস্ট করা মার্কেট বিশ্লেষণ আপনার সচেতনতা বৃদ্ধির জন্য প্রদান করা হয়, ট্রেড করার নির্দেশনা প্রদানের জন্য প্রদান করা হয় না।
ইন্সটাফরেক্স বিশ্লেষণমূলক পর্যালোচনাগুলো আপনাকে মার্কেট প্রবণতা সম্পর্কে পুরোপুরি সচেতন করবে! ইন্সটাফরেক্সের একজন গ্রাহক হওয়ায়, দক্ষ ট্রেডিং এর জন্য আপনাকে অনেক সেবা বিনামূল্যে প্রদান করা হয়।


