


The legend in the InstaSpot team!
Legend! You think that's bombastic rhetoric? But how should we call a man, who became the first Asian to win the junior world chess championship at 18 and who became the first Indian Grandmaster at 19? That was the start of a hard path to the World Champion title for Viswanathan Anand, the man who became a part of history of chess forever. Now one more legend in the InstaSpot team!


Borussia is one of the most titled football clubs in Germany, which has repeatedly proved to fans: the spirit of competition and leadership will certainly lead to success. Trade in the same way that sports professionals play the game: confidently and actively. Keep a "pass" from Borussia FC and be in the lead with InstaSpot!

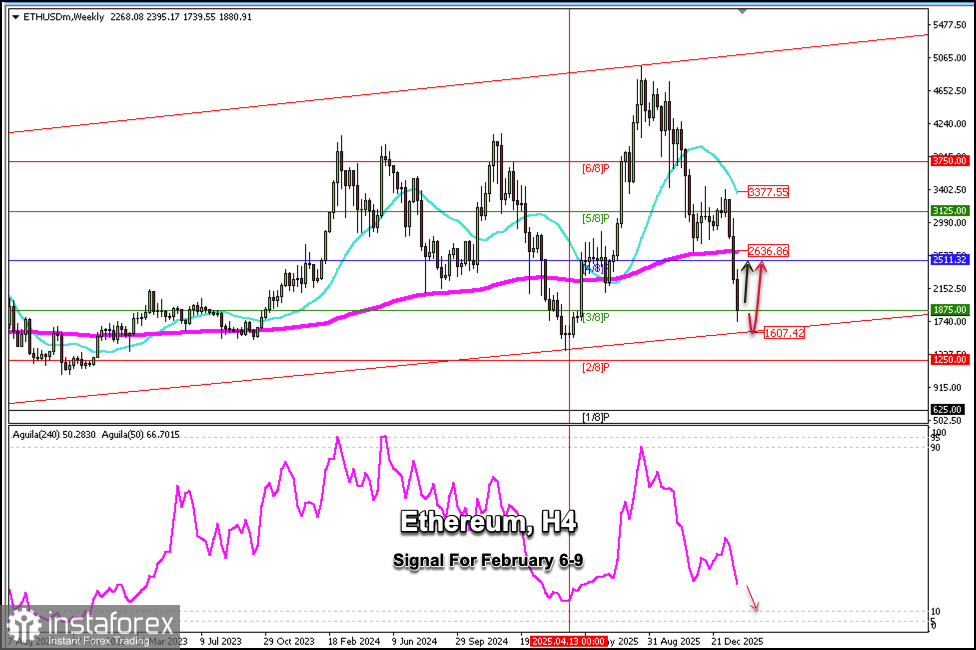
Ethereum (ETH/USD) is trading around $1,875, an area where the 3/8 Murray is located and within the uptrend channel formed since 2020.
The sharp technical correction over the last three weeks caused Ethereum to fall below the psychological level of $3,000 to levels of $1,800, losing more than 60% from its peak reached in July 2025.
It is likely that ETH/USD will remain under bearish pressure in the coming days and is expected to reach the bottom of the uptrend channel around $1,607.
If ETH consolidates above the 3/8 Murray in the coming hours, we could look for opportunities to buy with targets at the 4/8 Murray around $2,511.
On the other hand, a technical rebound around the $1,600 zone, where the lower band of the uptrend channel is located, will be seen as an opportunity to open long positions with targets at the 200 EMA around $2,636. This is a weekly trading plan.
We must be careful, as the Eagle indicator is showing a negative signal. Ethereum is likely to be under bearish pressure over the next few days as the $1,6000 - $2,000 zone could be a price range where we can look for positions to buy and sell.
*এখানে পোস্ট করা মার্কেট বিশ্লেষণ আপনার সচেতনতা বৃদ্ধির জন্য প্রদান করা হয়, ট্রেড করার নির্দেশনা প্রদানের জন্য প্রদান করা হয় না।
ইন্সটাফরেক্স বিশ্লেষণমূলক পর্যালোচনাগুলো আপনাকে মার্কেট প্রবণতা সম্পর্কে পুরোপুরি সচেতন করবে! ইন্সটাফরেক্সের একজন গ্রাহক হওয়ায়, দক্ষ ট্রেডিং এর জন্য আপনাকে অনেক সেবা বিনামূল্যে প্রদান করা হয়।


