


The legend in the InstaSpot team!
Legend! You think that's bombastic rhetoric? But how should we call a man, who became the first Asian to win the junior world chess championship at 18 and who became the first Indian Grandmaster at 19? That was the start of a hard path to the World Champion title for Viswanathan Anand, the man who became a part of history of chess forever. Now one more legend in the InstaSpot team!


Borussia is one of the most titled football clubs in Germany, which has repeatedly proved to fans: the spirit of competition and leadership will certainly lead to success. Trade in the same way that sports professionals play the game: confidently and actively. Keep a "pass" from Borussia FC and be in the lead with InstaSpot!

Recent media reports have raised concerns about potential intervention by the Bank of Japan due to a significant weakening of the national currency, which has declined by approximately 13% since October. Many banks and investment firms view this as a likely scenario ahead of the Japanese central bank's meeting in January. Let's analyze this situation using technical analysis to find an answer.
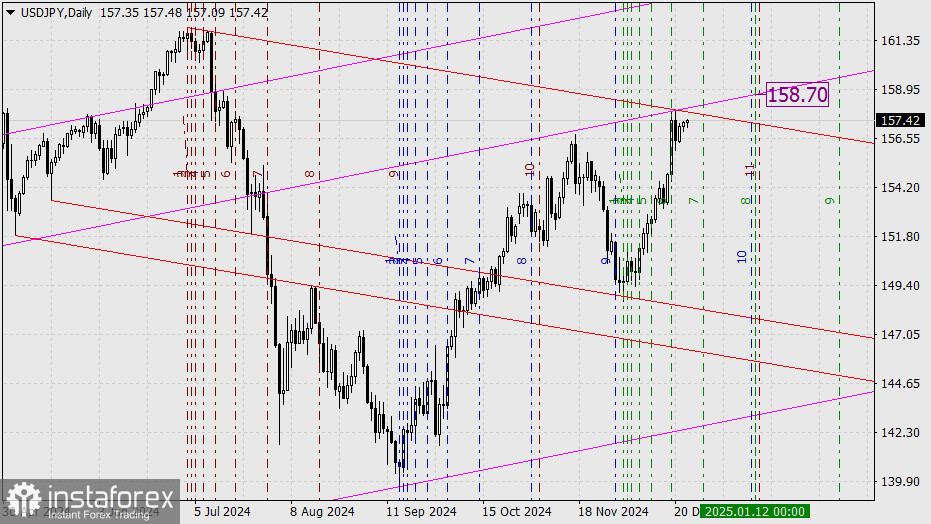
On the daily chart, we apply three Fibonacci time zones:
We identified a point where three timelines from different zones converge around January 12–13: the 11th line of the brown grid, the 10th line of the blue grid, and the 8th line of the green grid. However, since the chart does not account for future weekends—including the New Year holiday—the adjusted date is closer to January 21–22, coinciding with the BOJ meeting scheduled for January 23–24. It seems that following this meeting, a long-term strengthening of the yen may begin, potentially breaking below the December low and dipping beneath the lower boundary of the ascending pink price channel. In this context, the prospect of intervention becomes less significant, as the USD/JPY pair could decline due to an interest rate hike.
There is still a month until the central bank meeting. During this time, a local decline in the currency pair is possible, potentially approaching either the red line of the descending channel or the pink line of the ascending channel. A short-term rise to the 158.70 level may follow, which could ultimately form a triangular (flag-like) pattern. Alternatively, a different chart pattern might emerge if the price fails to break above the upper boundary of the descending price channel (a descending flag).
*এখানে পোস্ট করা মার্কেট বিশ্লেষণ আপনার সচেতনতা বৃদ্ধির জন্য প্রদান করা হয়, ট্রেড করার নির্দেশনা প্রদানের জন্য প্রদান করা হয় না।
ইন্সটাফরেক্স বিশ্লেষণমূলক পর্যালোচনাগুলো আপনাকে মার্কেট প্রবণতা সম্পর্কে পুরোপুরি সচেতন করবে! ইন্সটাফরেক্সের একজন গ্রাহক হওয়ায়, দক্ষ ট্রেডিং এর জন্য আপনাকে অনেক সেবা বিনামূল্যে প্রদান করা হয়।


