


The legend in the InstaSpot team!
Legend! You think that's bombastic rhetoric? But how should we call a man, who became the first Asian to win the junior world chess championship at 18 and who became the first Indian Grandmaster at 19? That was the start of a hard path to the World Champion title for Viswanathan Anand, the man who became a part of history of chess forever. Now one more legend in the InstaSpot team!


Borussia is one of the most titled football clubs in Germany, which has repeatedly proved to fans: the spirit of competition and leadership will certainly lead to success. Trade in the same way that sports professionals play the game: confidently and actively. Keep a "pass" from Borussia FC and be in the lead with InstaSpot!

On Thursday, the market observes somewhat contradictory dynamics of the dollar. It weakens in the DXY index, which primarily consists of the euro, but strengthens against safe-haven assets—the yen, franc, and gold.
At the same time, market participants who are in active short positions on the dollar may want to pay attention to the dynamics of U.S. government bond yields, which continue to rise.
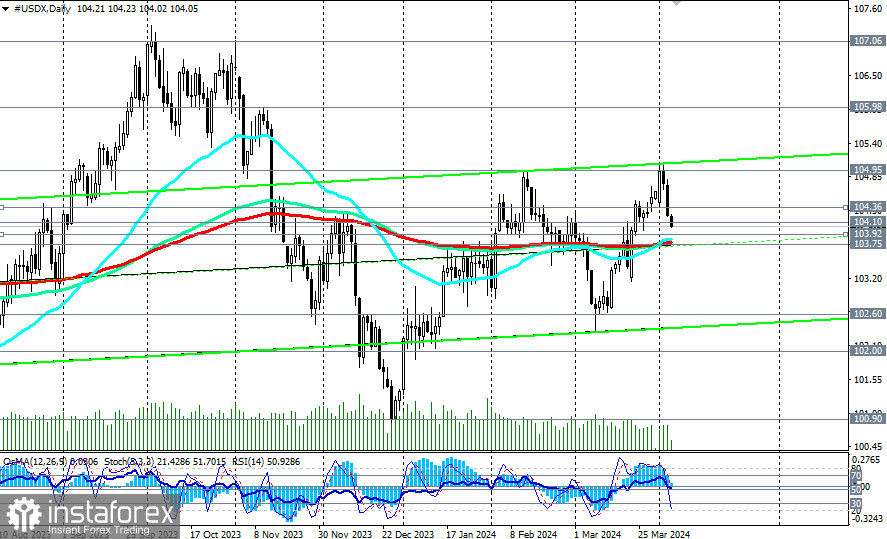
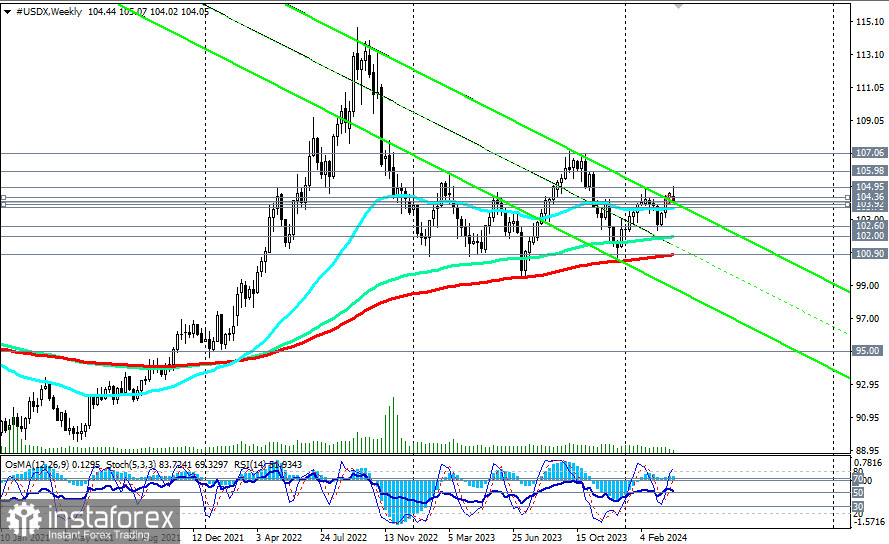
From a technical point of view, the dollar index (CFD #USDX in the MT4 terminal) remains in a bullish market zone, medium-term—above the support level of 103.75 (200 EMA on the daily chart), long-term—above the key support level of 100.90 (200 EMA on the weekly chart).
Therefore, long positions on the dollar index remain preferable for now.
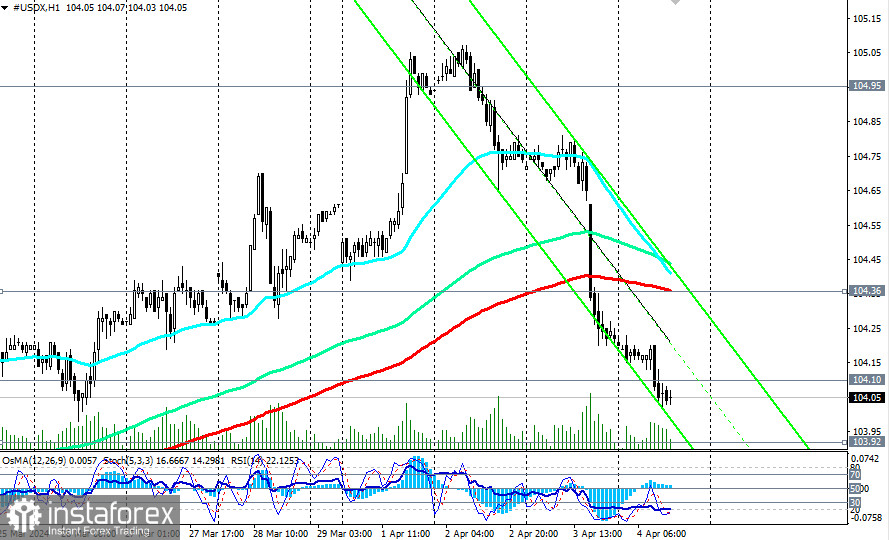
A signal for new purchases could be the breakout of the important short-term resistance level of 104.36 (200 EMA on the 1-hour chart).
In case of a decrease to the support levels of 103.92 (200 EMA on the 4-hour chart) and 103.75 (200 EMA, 144 EMA on the daily chart), it is possible to place pending limit orders for purchase with stops below the 103.60 mark.
In an alternative scenario, after the confirmed breakout of the support level at 103.75, the price may deepen into the downward channel on the weekly chart, with targets at support levels of 102.60 and 102.00 (144 EMA on the weekly chart).
The breakout of the key support level of 100.90 (200 EMA on the weekly chart) will bring the DXY into the long-term bear market zone. The bullish trend of the dollar will be broken.
This scenario may gain momentum if tomorrow's U.S. Labor Department report turns out to be significantly weaker than forecasted. Further dynamics of the dollar and its DXY index will largely depend on the fundamental background and the actions of the Federal Reserve.
Support levels: 104.10, 104.00, 103.92, 103.75, 103.00, 102.60, 102.00, 101.00, 100.90, 100.00
Resistance levels: 104.36, 104.95, 105.00, 106.00, 106.80, 107.00, 107.30
Trading Scenarios
Main scenario: BuyStop 104.40. Stop-Loss 103.60. Targets 104.95, 105.00, 106.00, 106.80, 107.00, 107.30
Alternative scenario: SellStop 103.60. Stop-Loss 104.10. Targets 103.00, 102.60, 102.00, 101.00, 100.90, 100.00
"Targets" correspond to support/resistance levels. This also does not mean that they will necessarily be reached, but they can serve as a guideline for planning and placing your trading positions.
*এখানে পোস্ট করা মার্কেট বিশ্লেষণ আপনার সচেতনতা বৃদ্ধির জন্য প্রদান করা হয়, ট্রেড করার নির্দেশনা প্রদানের জন্য প্রদান করা হয় না।
ইন্সটাফরেক্স বিশ্লেষণমূলক পর্যালোচনাগুলো আপনাকে মার্কেট প্রবণতা সম্পর্কে পুরোপুরি সচেতন করবে! ইন্সটাফরেক্সের একজন গ্রাহক হওয়ায়, দক্ষ ট্রেডিং এর জন্য আপনাকে অনেক সেবা বিনামূল্যে প্রদান করা হয়।


