


Our team has over 7,000,000 traders!
Every day we work together to improve trading. We get high results and move forward.
Recognition by millions of traders all over the world is the best appreciation of our work! You made your choice and we will do everything it takes to meet your expectations!
We are a great team together!
InstaSpot. Proud to work for you!


Actor, UFC 6 tournament champion and a true hero!
The man who made himself. The man that goes our way.
The secret behind Taktarov's success is constant movement towards the goal.
Reveal all the sides of your talent!
Discover, try, fail - but never stop!
InstaSpot. Your success story starts here!

Trend analysis
GBP/USD may continue its upward movement this week, rising from the level of 1.2622 (closing price of the last weekly candle) toward the 23.6% retracement level of 1.2690 (blue dashed line). Following this, the pair will appraoach the 14.6% retracement level of 1.2766 (blue dashed line).
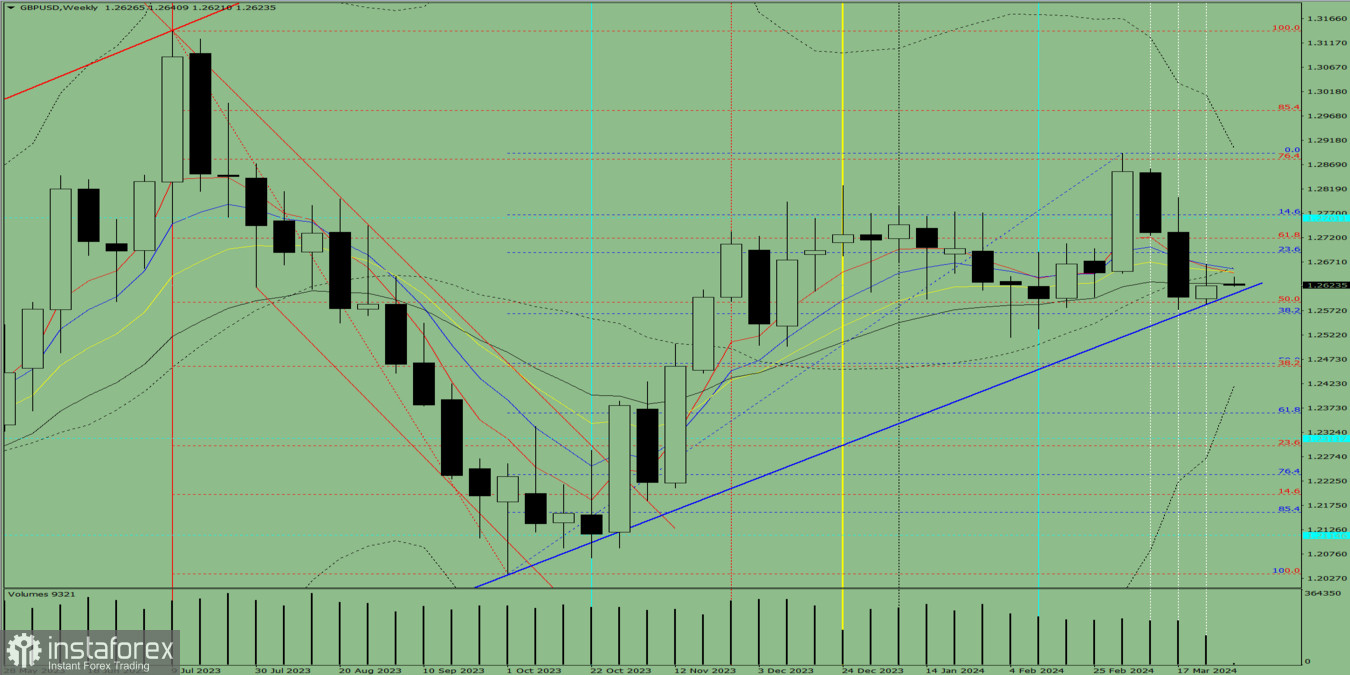
Fig. 1 (weekly chart)
Comprehensive analysis:
Indicator analysis - upward
Fibonacci levels - upward
Volumes - upward
Candlestick analysis - upward
Trend analysis - upward
Bollinger bands - upward
Monthly chart - upward
Conclusion: The indicators point to an upward movement in GBP/USD.
Overall conclusion: The pair will have a bullish trend, with no first lower shadow on the weekly white candle (Monday - upward) and a second upper shadow (Friday - downward).
So, during the week, pound will climb from 1.2622 (closing price of the last weekly candle) to the 23.6% retracement level of 1.2690 (blue dashed line), and then move toward the 14.6% retracement level of 1.2766 (blue dashed line).
Alternatively, it could rise from 1.2622 (closing price of the last weekly candle) to the 61.8% retracement level of 1.2719 (red dashed line), followed by a decline to the 23.6% retracement level of 1.2690 (blue dashed line).
*এখানে পোস্ট করা মার্কেট বিশ্লেষণ আপনার সচেতনতা বৃদ্ধির জন্য প্রদান করা হয়, ট্রেড করার নির্দেশনা প্রদানের জন্য প্রদান করা হয় না।
ইন্সটাফরেক্স বিশ্লেষণমূলক পর্যালোচনাগুলো আপনাকে মার্কেট প্রবণতা সম্পর্কে পুরোপুরি সচেতন করবে! ইন্সটাফরেক্সের একজন গ্রাহক হওয়ায়, দক্ষ ট্রেডিং এর জন্য আপনাকে অনেক সেবা বিনামূল্যে প্রদান করা হয়।


