


Our team has over 7,000,000 traders!
Every day we work together to improve trading. We get high results and move forward.
Recognition by millions of traders all over the world is the best appreciation of our work! You made your choice and we will do everything it takes to meet your expectations!
We are a great team together!
InstaSpot. Proud to work for you!


Actor, UFC 6 tournament champion and a true hero!
The man who made himself. The man that goes our way.
The secret behind Taktarov's success is constant movement towards the goal.
Reveal all the sides of your talent!
Discover, try, fail - but never stop!
InstaSpot. Your success story starts here!

The record-breaking price surge caught many gold market analysts and experts off guard. At the same time, some economists believe that the increase in the price of gold has gone too far, and in the short term, the probability of a correction is growing.
The expected data on the U.S. labor market on Friday and the fresh inflation data on Tuesday could significantly diminish or undermine hopes for a reduction in the Federal Reserve's interest rates this year if both exceed market expectations.
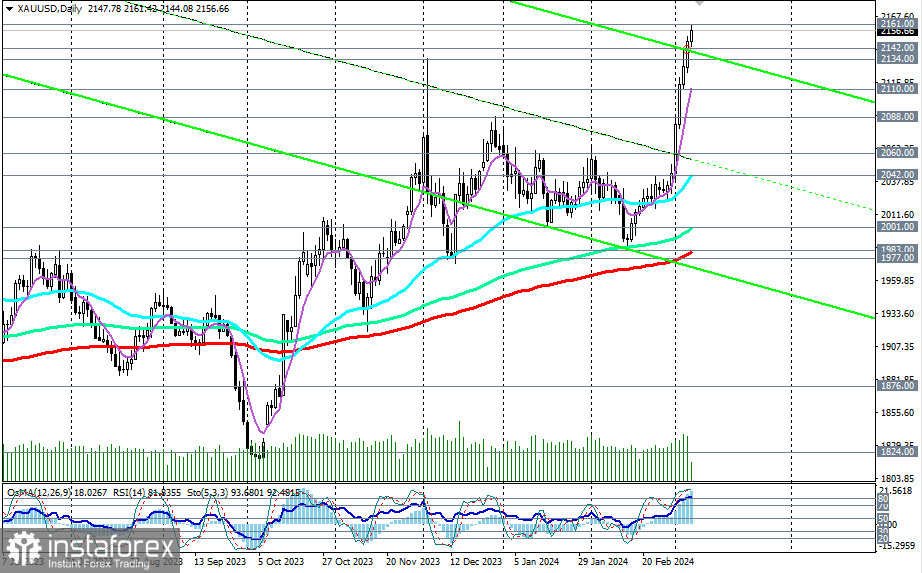
If this happens, a rebound and a price decline are possible near the levels of 2160.00 and 2170.00.
In this case, it is also worth focusing on local support levels at 2142.00 and 2134.00, a breakthrough of which could signal the start of a downward correction.
It may extend to the important support level of 2088.00 (200 EMA on the 1-hour chart) and last week's closing price level at 2083.00.

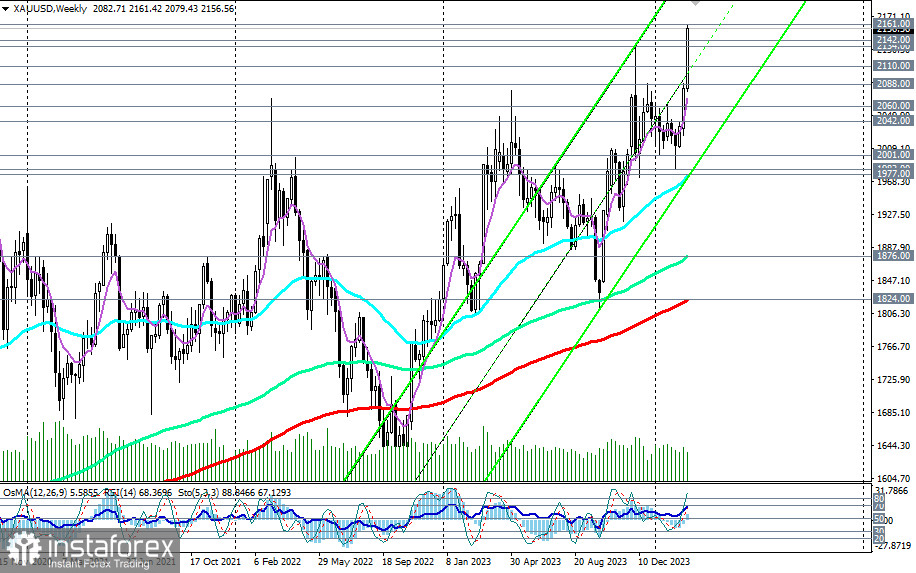
If the U.S. dollar buyers take the situation into their own hands, a deeper decline in XAU/USD is not excluded, down to the support level of 2042.00 (50 EMA on the daily chart).
However, the overall price dynamics and the XAU/USD pair show a prevailing upward trend.
A strong fundamental background creates conditions for the weakening of the dollar and the preservation of high demand for safe-haven assets, such as U.S. government bonds and gold.
In the case of breaking through the resistance zone at levels 2160.00 and 2170.00, further price growth towards 2300.00–2400.00 is possible. Bolder forecasts suggest an increase in gold prices to $3000.00 per ounce later this year.
The first signal to start implementing this scenario could be a breakthrough of today's record high at 2161.00.
Support levels: 2142.00, 2134.00, 2110.00, 2088.00, 2060.00, 2042.00, 2001.00, 2000.00, 1983.00, 1977.00, 1900.00, 1876.00, 1824.00
Resistance levels: 2161.00, 2170.00
Trading Scenarios
Main Scenario: Buy Stop 2162.00. Stop-Loss 2141.00. Targets: 2170.00, 2180.00, 2190.00, 2200.00, 2300.00
Alternative Scenario: Sell Stop 2129.00. Stop-Loss 2143.00. Targets 2110.00, 2088.00, 2060.00, 2042.00, 2001.00, 2000.00, 1983.00, 1977.00, 1900.00, 1876.00, 1824.00
"Targets" correspond to support/resistance levels. This also does not mean that they will necessarily be achieved, but they can serve as a guide when planning and placing your trading positions.
*এখানে পোস্ট করা মার্কেট বিশ্লেষণ আপনার সচেতনতা বৃদ্ধির জন্য প্রদান করা হয়, ট্রেড করার নির্দেশনা প্রদানের জন্য প্রদান করা হয় না।
ইন্সটাফরেক্স বিশ্লেষণমূলক পর্যালোচনাগুলো আপনাকে মার্কেট প্রবণতা সম্পর্কে পুরোপুরি সচেতন করবে! ইন্সটাফরেক্সের একজন গ্রাহক হওয়ায়, দক্ষ ট্রেডিং এর জন্য আপনাকে অনেক সেবা বিনামূল্যে প্রদান করা হয়।


