


The legend in the InstaSpot team!
Legend! You think that's bombastic rhetoric? But how should we call a man, who became the first Asian to win the junior world chess championship at 18 and who became the first Indian Grandmaster at 19? That was the start of a hard path to the World Champion title for Viswanathan Anand, the man who became a part of history of chess forever. Now one more legend in the InstaSpot team!


Borussia is one of the most titled football clubs in Germany, which has repeatedly proved to fans: the spirit of competition and leadership will certainly lead to success. Trade in the same way that sports professionals play the game: confidently and actively. Keep a "pass" from Borussia FC and be in the lead with InstaSpot!

Trend analysis (Fig. 1).
The EUR/USD currency pair may move upward from the level of 1.0849 (closing of yesterday's daily candle) to test the upper fractal at 1.0888 (daily candle from 22/02/2024). From here, a continued upward movement is possible with a target of 1.0917, the 50% pullback level (red dotted line). Upon reaching this level, the price may move down.
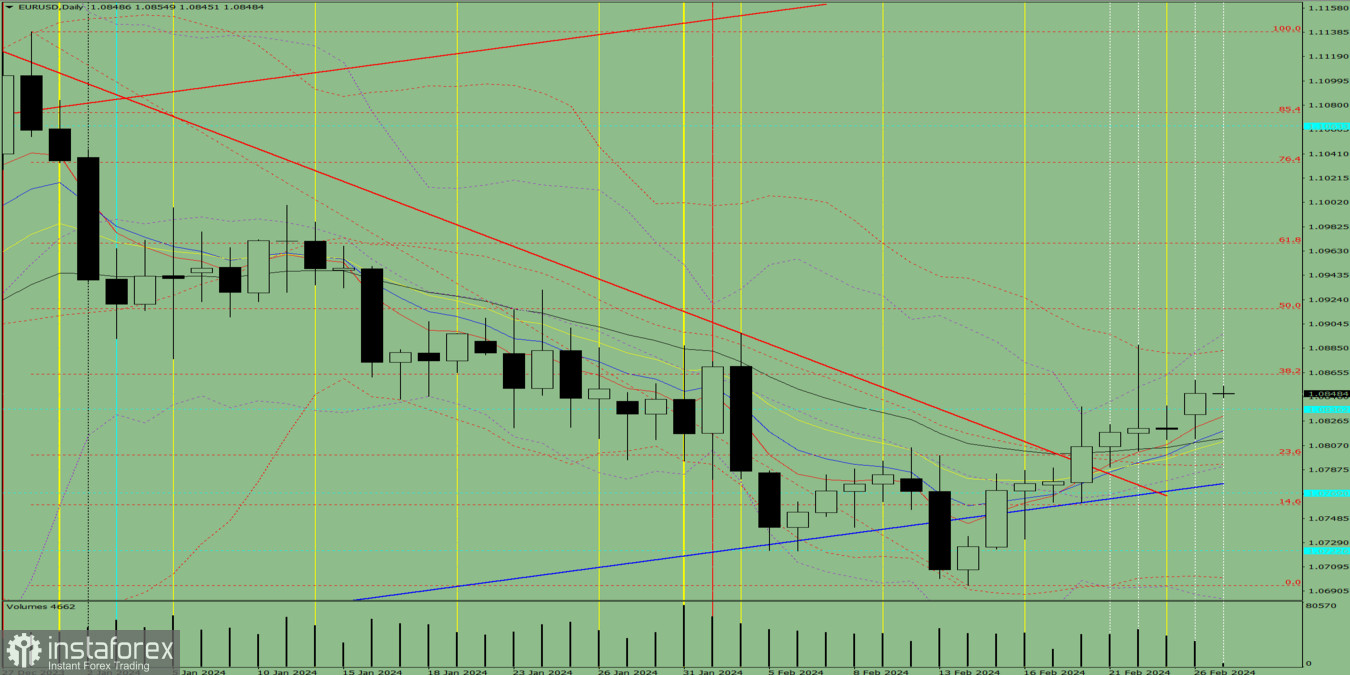
Fig. 1 (daily chart).
Comprehensive analysis:
General conclusion: Today, the price may move upward from the level of 1.0849 (closing of yesterday's daily candle) to test the upper fractal at 1.0888 (daily candle from 22/02/2024). From here, a continued upward movement is possible with a target of 1.0917, the 50% pullback level (red dotted line). Upon reaching this level, the price may move down.
Alternatively, from the level of 1.0849, the price may move up to test the upper fractal at 1.0888 (daily candle from 22/02/2024), and after that, the price may move downward with a target of 1.0864, the 38.2% pullback level (red dotted line) line).
*এখানে পোস্ট করা মার্কেট বিশ্লেষণ আপনার সচেতনতা বৃদ্ধির জন্য প্রদান করা হয়, ট্রেড করার নির্দেশনা প্রদানের জন্য প্রদান করা হয় না।
ইন্সটাফরেক্স বিশ্লেষণমূলক পর্যালোচনাগুলো আপনাকে মার্কেট প্রবণতা সম্পর্কে পুরোপুরি সচেতন করবে! ইন্সটাফরেক্সের একজন গ্রাহক হওয়ায়, দক্ষ ট্রেডিং এর জন্য আপনাকে অনেক সেবা বিনামূল্যে প্রদান করা হয়।


