


Our team has over 7,000,000 traders!
Every day we work together to improve trading. We get high results and move forward.
Recognition by millions of traders all over the world is the best appreciation of our work! You made your choice and we will do everything it takes to meet your expectations!
We are a great team together!
InstaSpot. Proud to work for you!


Actor, UFC 6 tournament champion and a true hero!
The man who made himself. The man that goes our way.
The secret behind Taktarov's success is constant movement towards the goal.
Reveal all the sides of your talent!
Discover, try, fail - but never stop!
InstaSpot. Your success story starts here!

EUR/USD
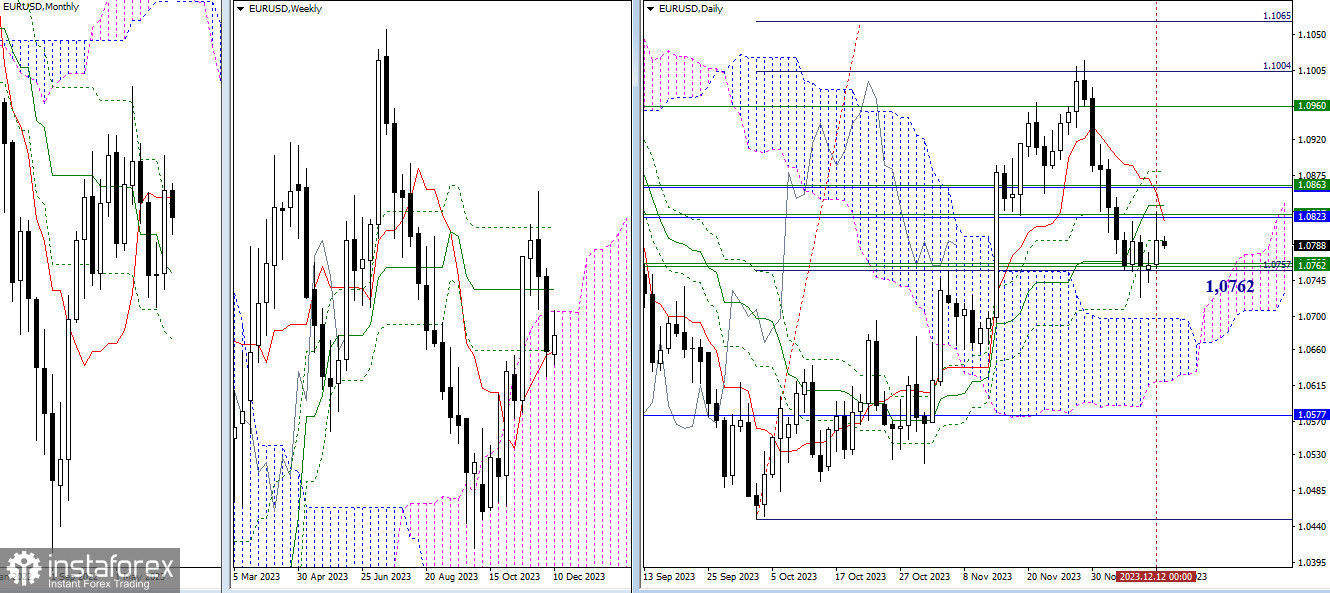
Higher Timeframes
Bulls executed a retest yesterday, reaching the area of 1.0823 (monthly Fibonacci Kijun + upper boundary of the weekly cloud). The resistance zone of 1.0823 – 1.0868 currently combines the levels of the emerging death cross of the daily Ichimoku cloud, as well as important monthly and weekly benchmarks. Consolidation above will allow discussions about the next, more distant prospects for bullish players. For example, bulls will once again consider eliminating the weekly death cross (1.0960) and achieving the target of breaking through the daily cloud (1.1004 – 1.1065). The breakout of existing weekly supports around 1.0762 will bring relevance and opportunities for the development and strengthening of bearish sentiments, with potential targets being the daily Ichimoku cloud (1.0697 – 1.0620) and the monthly medium-term trend (1.0577).

H4 – H1
On lower timeframes, there is currently a struggle for key levels. The weekly long-term trend (1.0777) can change its slope at any moment and start supporting further recovery of bullish positions by exiting the horizontal position. In the event of an intraday rise, the classic pivot points (1.0829 – 1.0863 – 1.0898) can be used as reference points. The loss of key levels (1.0794 – 1.0777) and a return to bearish market activity will bring relevance and significance to the supports of classic pivot points (1.0760 – 1.0725 – 1.0691).
***
GBP/USD
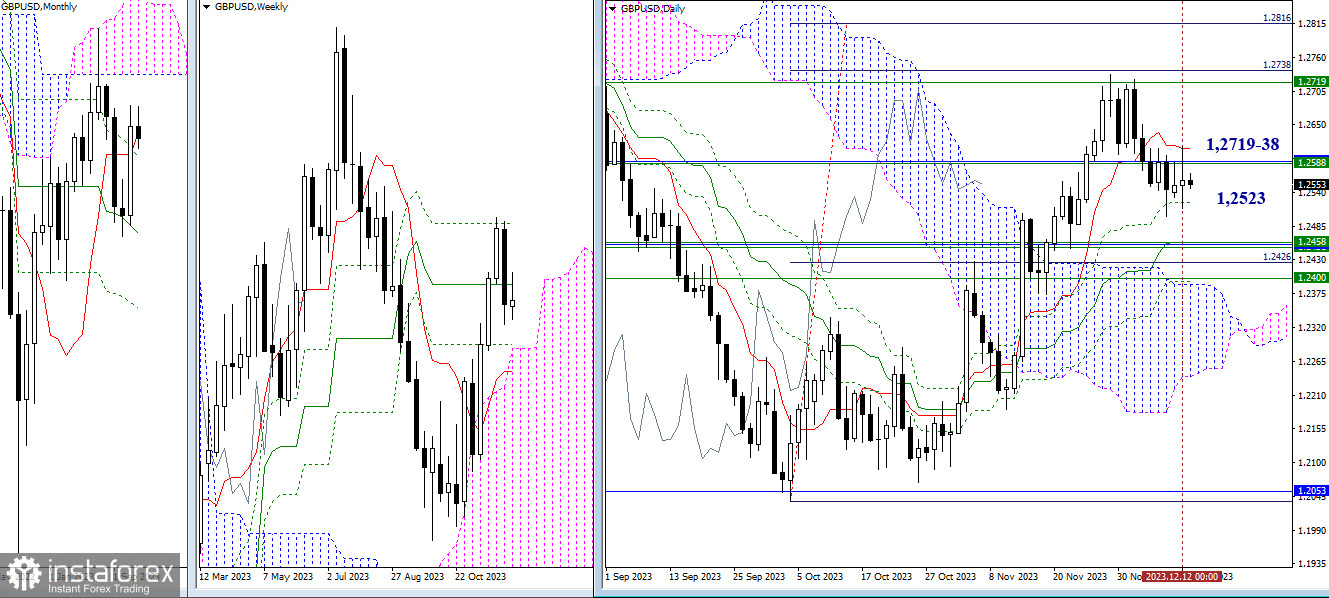
Higher Timeframes
The pound continues to trade, relying on daily support (1.2523) and facing the resistance zone of 1.2612 – 1.2588 (daily short-term trend + weekly medium-term trend + monthly short-term trend). If freed from the above constraints, a situation may develop strengthening bullish sentiment. Subsequent benchmarks, in this case, may be the support zone (1.2458 – 1.2390), where resistance levels of all higher timeframes are currently gathered, and the resistance zone (1.2719-38 – 1.2816), combining the final level of the weekly death cross and the daily target.

H4 – H1
On lower timeframes, key levels continue to be the center of attraction, which today have practically come together in the area of 1.2562-66 (central pivot point of the day + weekly long-term trend). The horizontal arrangement of levels indicates uncertainty. Bullish activity in the current situation may develop through the rise and overcoming of the resistance of classic pivot points (1.2611 – 1.2663 – 1.2712). The development of bearish activity within the day will be possible upon the breakdown of supports of classic pivot points (1.2510 – 1.2461 – 1.2409).
***
The technical analysis of the situation uses:
Higher timeframes - Ichimoku Kinko Hyo (9.26.52) + Fibonacci Kijun levels
Lower timeframes - H1 - Pivot Points (classic) + Moving Average 120 (weekly long-term trend)
*এখানে পোস্ট করা মার্কেট বিশ্লেষণ আপনার সচেতনতা বৃদ্ধির জন্য প্রদান করা হয়, ট্রেড করার নির্দেশনা প্রদানের জন্য প্রদান করা হয় না।
ইন্সটাফরেক্স বিশ্লেষণমূলক পর্যালোচনাগুলো আপনাকে মার্কেট প্রবণতা সম্পর্কে পুরোপুরি সচেতন করবে! ইন্সটাফরেক্সের একজন গ্রাহক হওয়ায়, দক্ষ ট্রেডিং এর জন্য আপনাকে অনেক সেবা বিনামূল্যে প্রদান করা হয়।


