


Bitcoin's latest price action has been a rollercoaster ride for investors, oscillating between sharp dips and swift recoveries. The cryptocurrency's resilience was tested yet again following a brief downturn, which saw Bitcoin plunge to $50,700 and Ether dipping just under $2,890.
The initial sell-off came amid a backdrop of anticipation for chipmaker Nvidia's (NVDA) fourth-quarter earnings report. The subsequent report, which exceeded expectations, sparked a rally in AI tokens and pushed the total market cap of these tokens over the $15 billion mark. This rally was punctuated by Worldcoin's WLD reaching an all-time high.
Despite this, Bitcoin and Ether managed to claw back their losses, signaling strong market confidence. The recovery came despite over $200 million in liquidations in crypto-tracked futures, primarily affecting long positions.
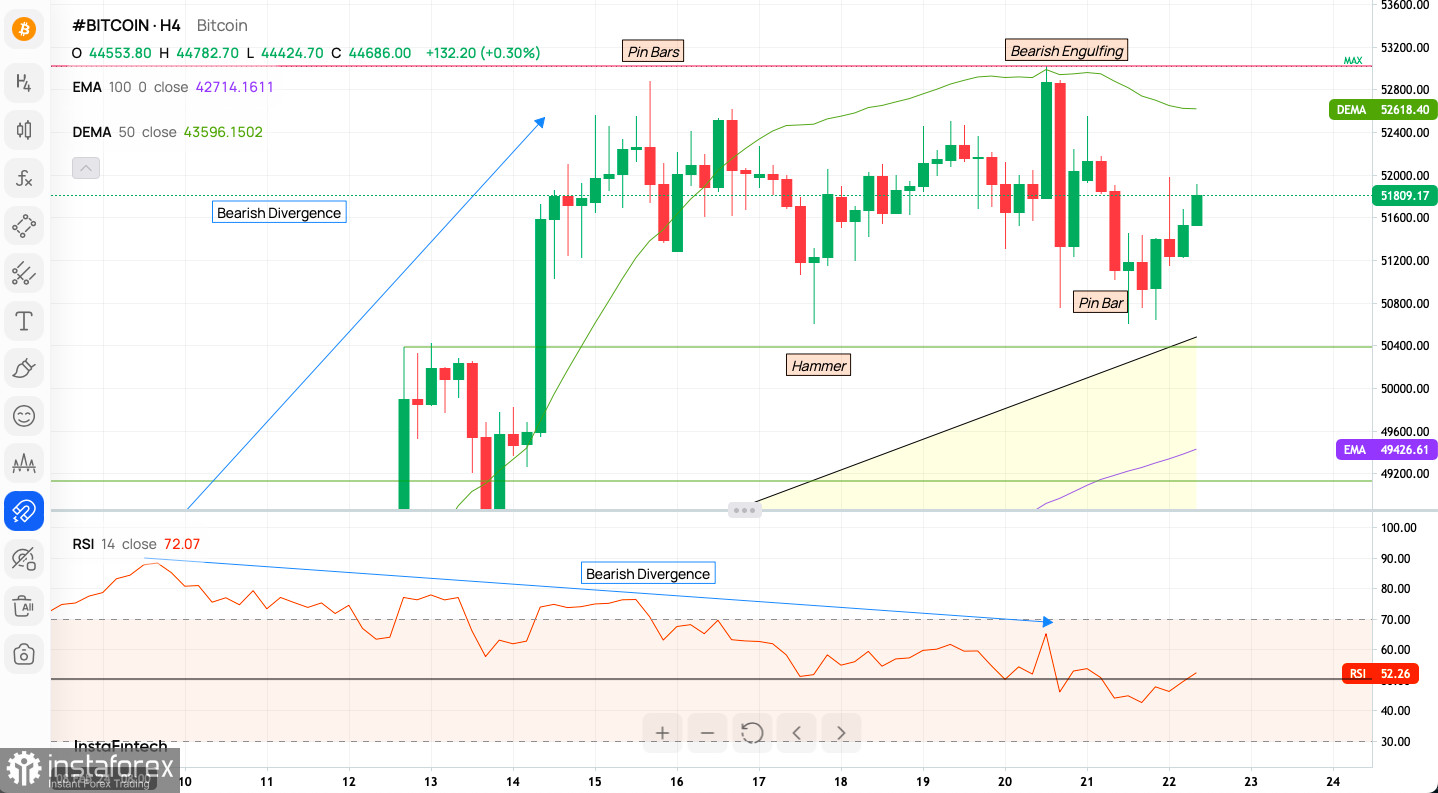
The BTC/USD HT time frame chart reveals a complex narrative. Indicators such as a bearish divergence and a bearish engulfing pattern suggest caution, while a hammer and subsequent pin bars indicate potential for a bullish reversal. The RSI remains high, hinting at sustained buying interest despite the recent dip.
Indicator Signals:
Market Sentiment:
The sentiment is very bullish, with 73% versus 27% bears, and has been strengthening over the past week and the last three days. This bullishness is consistent with the general trend observed in the market.
Weekly Pivot Points:
Bitcoin's current stance above the weekly pivot point at $52,175 suggests a favorable position for the bulls. The resistance levels WR1 through WR3 serve as potential targets for upward movement, while WS1 through WS3 offer support levels in case of a reversal.
Based on the provided chart and fundamental context, let's explore both bullish and bearish scenarios for Bitcoin.
Bitcoin's ability to rebound after the Nvidia-induced dip demonstrates its resilient nature and suggests a bullish sentiment among investors. If this sentiment prevails, bolstered by the overall bullish trend indicated by technical indicators and moving averages, we could see Bitcoin challenge the upper resistance levels. The specific technical signals to watch include:
Despite the recovery, there are signs that caution is warranted. The bearish divergence noted on the RSI, along with the bearish engulfing pattern, could foreshadow a potential downturn. Here's what could happen in a bearish scenario:
In both scenarios, it's crucial for investors to monitor key technical levels and stay abreast of market news that could impact sentiment and price action. The dynamic crypto market requires vigilance and adaptability, with a clear strategy for responding to both bullish and bearish developments.
Bitcoin's latest movements underscore its volatile yet resilient nature. While Nvidia's earnings have temporarily shifted focus to AI tokens, Bitcoin's strong recovery reaffirms its dominance in the crypto market. Investors remain bullish, and the sentiment is echoed by technical indicators, suggesting that Bitcoin may continue its upward trend.
The begginers in forex trading need to be very careful when making decisions about entering the market. Before the release of important reports, it is best to stay out of the market to avoid being caught in sharp market fluctuations due to increased volatility. If you decide to trade during the news release, then always place stop orders to minimize losses.
Without placing stop orders, you can very quickly lose your entire deposit, especially if you do not use money management and trade large volumes. For successful trading, you need to have a clear trading plan and stay focues and disciplined. Spontaneous trading decision based on the current market situation is an inherently losing strategy for a scalper or daytrader.
#instaforex #analysis #sebastianseliga
*এখানে পোস্ট করা মার্কেট বিশ্লেষণ আপনার সচেতনতা বৃদ্ধির জন্য প্রদান করা হয়, ট্রেড করার নির্দেশনা প্রদানের জন্য প্রদান করা হয় না।
ইন্সটাফরেক্স বিশ্লেষণমূলক পর্যালোচনাগুলো আপনাকে মার্কেট প্রবণতা সম্পর্কে পুরোপুরি সচেতন করবে! ইন্সটাফরেক্সের একজন গ্রাহক হওয়ায়, দক্ষ ট্রেডিং এর জন্য আপনাকে অনেক সেবা বিনামূল্যে প্রদান করা হয়।


