


Exploring recent developments in the crypto market, particularly Bitcoin, sheds light on its dynamics against the backdrop of traditional fiat currencies. Gary Gensler's remarks offer insights into the contrasting perspectives on cryptocurrencies and fiat, prompting a closer examination of Bitcoin's technical outlook and potential trading scenarios.
Key Takeaways:

Crypto Industry Insights:In a recent tv interview, SEC Chairman Gary Gensler addressed the growing discourse surrounding Bitcoin's legitimacy and utility. While acknowledging Bitcoin's decentralized nature, Gensler underscored the fundamental differences between cryptocurrencies and traditional fiat currencies. He emphasized the widespread adoption and regulatory support enjoyed by fiat currencies, contrasting them with the decentralized structure of Bitcoin. Despite acknowledging Bitcoin's appeal, Gensler highlighted the importance of robust regulatory frameworks and central oversight in traditional financial systems.
Technical Analysis Overview:The BTC/USD pair continues its upward trajectory, setting a new yearly high amidst bullish momentum. With intraday support at $50,384 and resistance at $52,505, the short-term outlook remains favorable for bulls. A breach of the $52,565 level could pave the way for further upside towards $54,000 or $55,000, highlighting the resilience of bullish sentiment in the crypto market.
Trend Analysis:Bitcoin's price action reflects a bullish trend, characterized by higher highs and higher lows within an ascending channel pattern. While the price remains above the DEMA 50, indicating short-term bullishness, potential resistance looms at the EMA 100 level. Traders should closely monitor these moving averages for insights into price dynamics and trend continuation.
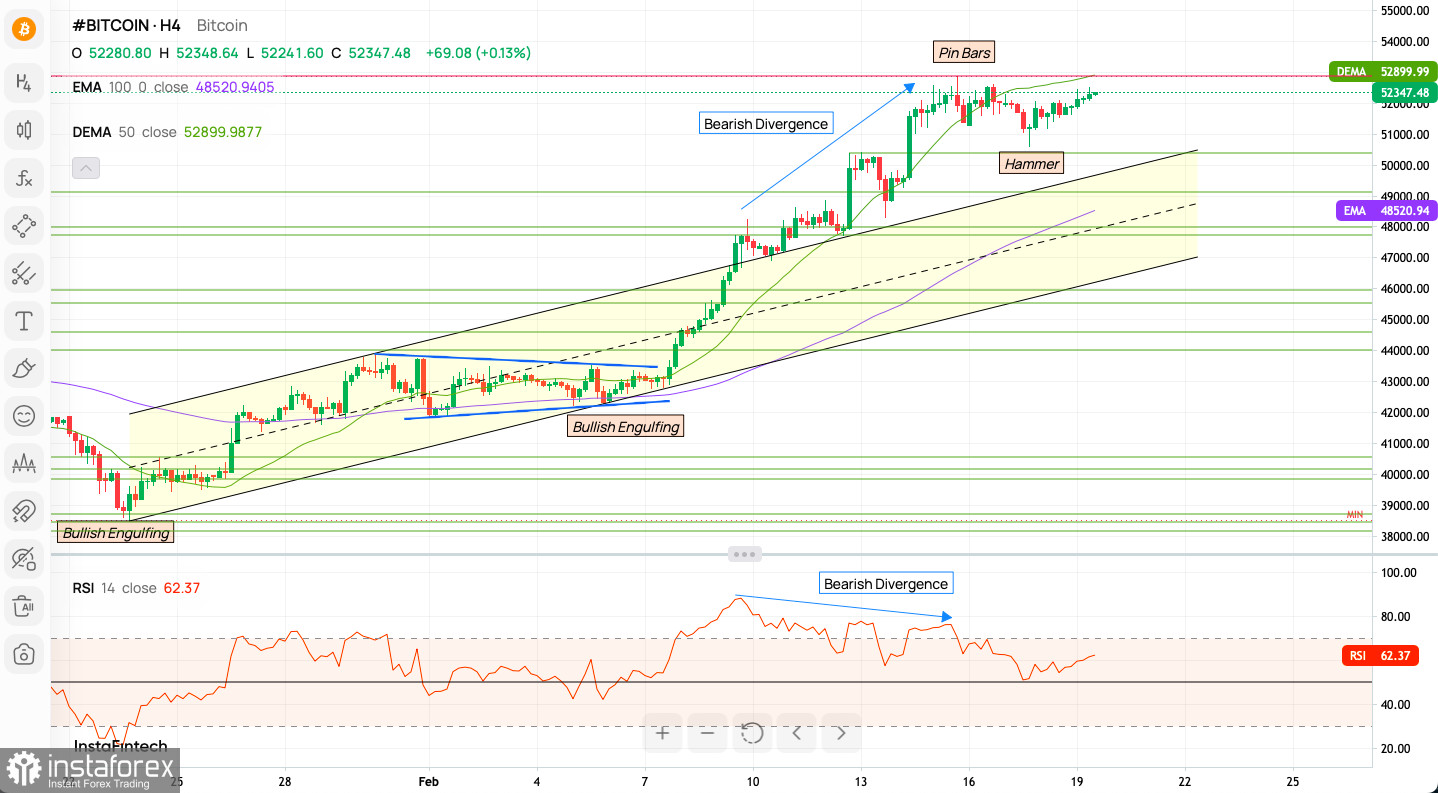
Momentum Indicators and Chart Patterns:The RSI suggests room for further upside, albeit below the overbought threshold, signaling sustained bullish momentum. Bullish chart patterns, such as the "Bullish Engulfing" and "Hammer" candlesticks, reinforce the uptrend. However, caution is warranted as a "Bearish Divergence" signals possible weakening momentum and a need for vigilance.
Support and Resistance Levels:
- 17 out of 23 technical indicators are showing Buy signal, 1 are showing Sell signal, 5 are Neutral
- 17 out of 18 moving averages are showing Buy signal, 1 are showing Sell signal
Weekly Pivot Points:Pivot points provide crucial reference levels for identifying potential trend reversals and key price zones. Traders can leverage these levels to refine their entry and exit strategies, enhancing risk management and trade execution.
WR3 - $53,330
WR2 - $52,753
WR1 - $52,484
Weekly Pivot - $52,175
WS1 - $51,907
WS2 - $51,597
WS3 - $51,017
Potential Scenarios:
Bullish Continuation:
Reversal (Bearish Scenario):
Considerations:
The begginers in forex trading need to be very careful when making decisions about entering the market. Before the release of important reports, it is best to stay out of the market to avoid being caught in sharp market fluctuations due to increased volatility. If you decide to trade during the news release, then always place stop orders to minimize losses.
Without placing stop orders, you can very quickly lose your entire deposit, especially if you do not use money management and trade large volumes. For successful trading, you need to have a clear trading plan and stay focues and disciplined. Spontaneous trading decision based on the current market situation is an inherently losing strategy for a scalper or daytrader.
#instaforex #analysis #sebastianseliga
*এখানে পোস্ট করা মার্কেট বিশ্লেষণ আপনার সচেতনতা বৃদ্ধির জন্য প্রদান করা হয়, ট্রেড করার নির্দেশনা প্রদানের জন্য প্রদান করা হয় না।
ইন্সটাফরেক্স বিশ্লেষণমূলক পর্যালোচনাগুলো আপনাকে মার্কেট প্রবণতা সম্পর্কে পুরোপুরি সচেতন করবে! ইন্সটাফরেক্সের একজন গ্রাহক হওয়ায়, দক্ষ ট্রেডিং এর জন্য আপনাকে অনেক সেবা বিনামূল্যে প্রদান করা হয়।


