


Our team has over 7,000,000 traders!
Every day we work together to improve trading. We get high results and move forward.
Recognition by millions of traders all over the world is the best appreciation of our work! You made your choice and we will do everything it takes to meet your expectations!
We are a great team together!
InstaSpot. Proud to work for you!


Actor, UFC 6 tournament champion and a true hero!
The man who made himself. The man that goes our way.
The secret behind Taktarov's success is constant movement towards the goal.
Reveal all the sides of your talent!
Discover, try, fail - but never stop!
InstaSpot. Your success story starts here!

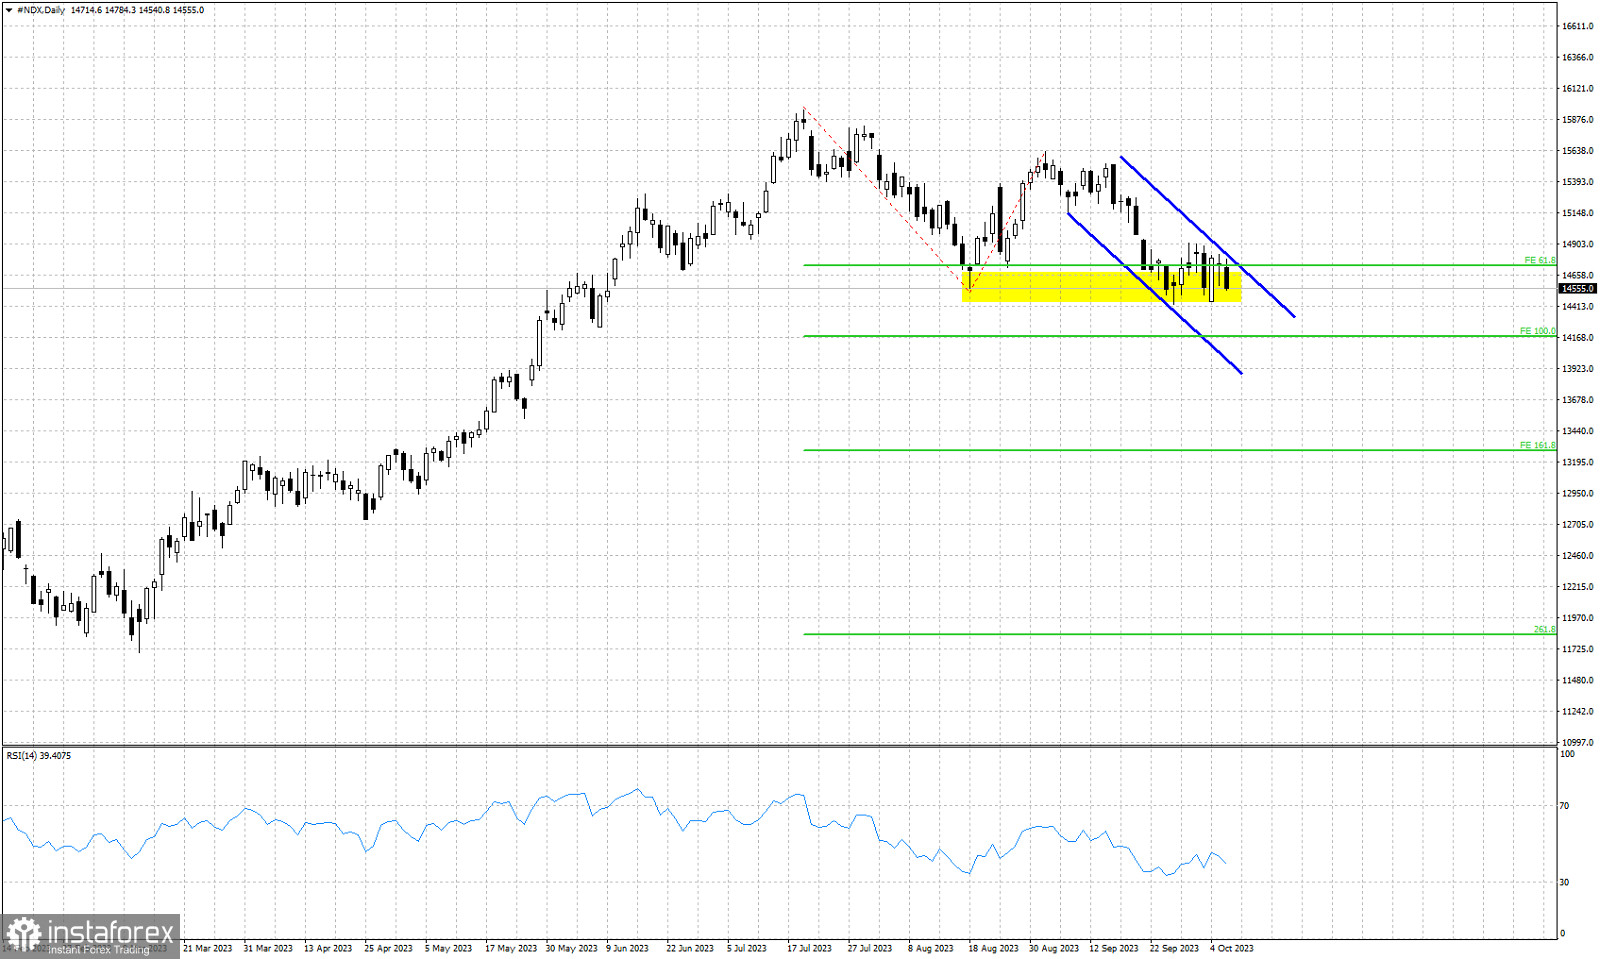
Green lines- Fibonacci extension targets
Yellow rectangle- support
Blue lines- bearish channel
NASDAQ is trading around 14,585. Price has made no real progress over the last 8 trading sessions. Price continues to move sideways around 14,620. Taking a wider look at the chart we see the lower high that was formed in August and the price currently on the brink of breaking to new lower lows. In the near term a downward sloping channel has been formed and price is challenging the horizontal support area marked with yellow in the accompanying chart. Our target is the 100% Fibonacci extension target at 14,180. Short-term trend remains bearish as long as price is trading inside the blue channel.
*এখানে পোস্ট করা মার্কেট বিশ্লেষণ আপনার সচেতনতা বৃদ্ধির জন্য প্রদান করা হয়, ট্রেড করার নির্দেশনা প্রদানের জন্য প্রদান করা হয় না।
ইন্সটাফরেক্স বিশ্লেষণমূলক পর্যালোচনাগুলো আপনাকে মার্কেট প্রবণতা সম্পর্কে পুরোপুরি সচেতন করবে! ইন্সটাফরেক্সের একজন গ্রাহক হওয়ায়, দক্ষ ট্রেডিং এর জন্য আপনাকে অনেক সেবা বিনামূল্যে প্রদান করা হয়।


