


Our team has over 7,000,000 traders!
Every day we work together to improve trading. We get high results and move forward.
Recognition by millions of traders all over the world is the best appreciation of our work! You made your choice and we will do everything it takes to meet your expectations!
We are a great team together!
InstaSpot. Proud to work for you!


Actor, UFC 6 tournament champion and a true hero!
The man who made himself. The man that goes our way.
The secret behind Taktarov's success is constant movement towards the goal.
Reveal all the sides of your talent!
Discover, try, fail - but never stop!
InstaSpot. Your success story starts here!

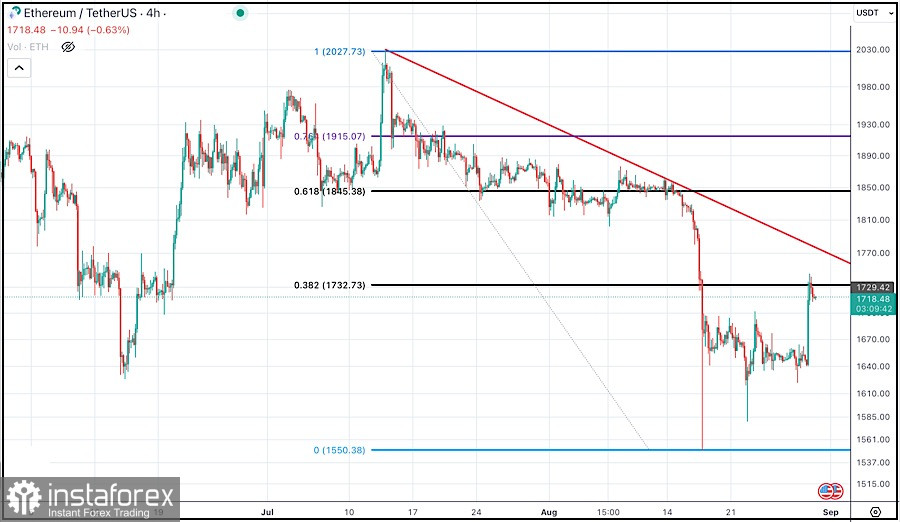
Ethereum, the second-largest cryptocurrency by market capitalisation, has been trading in a downward trend against the US dollar since reaching a historical high of 4868 $ on May 2021.
The ETH/USDT pair has formed lower highs and lower lows on the H4 chart, indicating a bearish momentum. The pair has also broken below several key support levels, such as 1800 and 1700 dollars.
Hence, the pair is still facing strong resistance from the descending trendline that connects the lower highs on the depicted chart.
Therefore, based on the technical analysis of the H4 chart, the outlook for the pair remains bearish in the short term.
Ethereum prices continued to decline to test the support level around 1600 which provided significant support.
A break below this level could open the door for further declines towards 1500 and 1300 levels. However, this couldn't happen.
On the other hand, a break above the price level of 1730, may enable further upside movement towards the descending trendline around 1770 for further retesting.
*এখানে পোস্ট করা মার্কেট বিশ্লেষণ আপনার সচেতনতা বৃদ্ধির জন্য প্রদান করা হয়, ট্রেড করার নির্দেশনা প্রদানের জন্য প্রদান করা হয় না।
ইন্সটাফরেক্স বিশ্লেষণমূলক পর্যালোচনাগুলো আপনাকে মার্কেট প্রবণতা সম্পর্কে পুরোপুরি সচেতন করবে! ইন্সটাফরেক্সের একজন গ্রাহক হওয়ায়, দক্ষ ট্রেডিং এর জন্য আপনাকে অনেক সেবা বিনামূল্যে প্রদান করা হয়।


