


Our team has over 7,000,000 traders!
Every day we work together to improve trading. We get high results and move forward.
Recognition by millions of traders all over the world is the best appreciation of our work! You made your choice and we will do everything it takes to meet your expectations!
We are a great team together!
InstaSpot. Proud to work for you!


Actor, UFC 6 tournament champion and a true hero!
The man who made himself. The man that goes our way.
The secret behind Taktarov's success is constant movement towards the goal.
Reveal all the sides of your talent!
Discover, try, fail - but never stop!
InstaSpot. Your success story starts here!

trend analysis
EUR/USD may start moving downwards this week from the level of 1.0867 (closing of the last weekly candle) to the 14.6% retracement level of 1.0725 (blue dotted line). But once this price is reached, the pair will resume its upward movement.
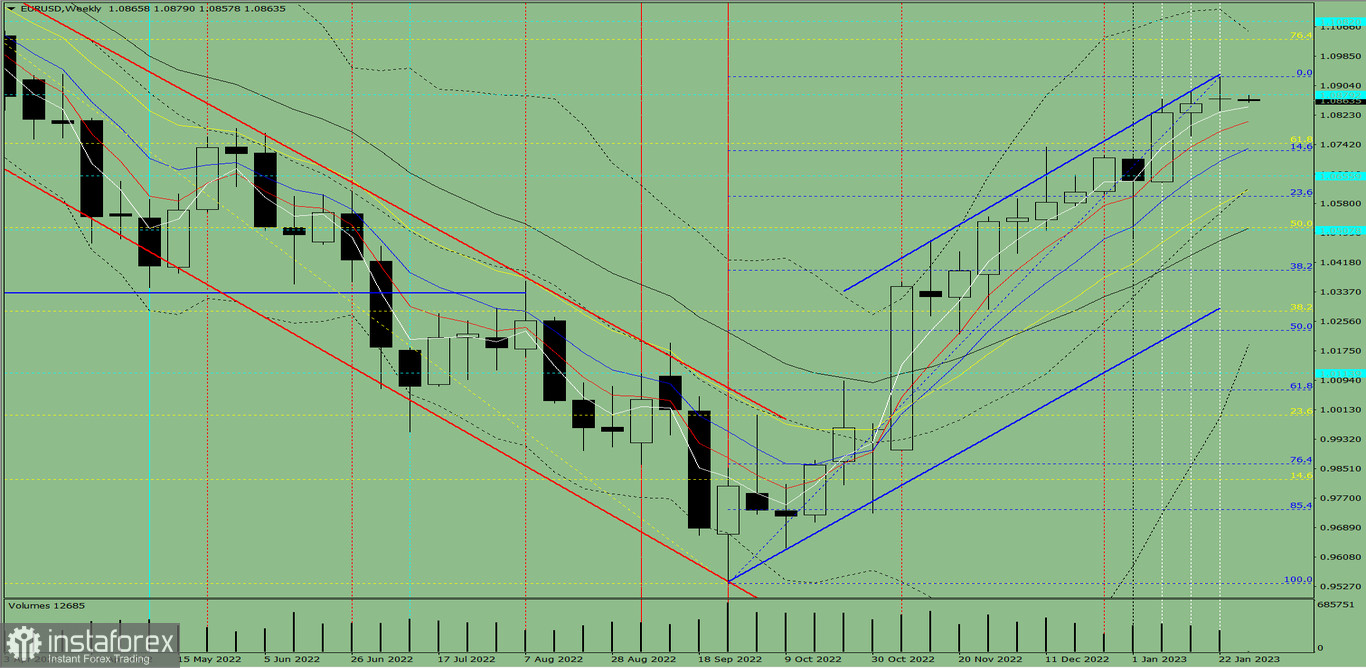
Fig. 1 (weekly chart)
comprehensive analysis:
Indicator analysis - downtrend
Fibonacci levels - downtrend
volumes - downtrend
Candlestick analysis - downtrend
Trend analysis - downtrend
Bollinger bands - uptrend
Monthly chart - uptrend
All these points to a downward movement in EUR/USD.
Conclusion: The pair will have a bearish trend, with no first upper shadow on the weekly black candle (Monday - down) and no second lower shadow (Friday - down).
So during the week, euro will fall from 1.0867 (closing of the last weekly candle) to the 14.6% retracement level of 1.0725 (blue dotted line), then bounce back to higher price levels.
Alternatively, the quote may dip from 1.0867 (closing of the last weekly candle) to the 23.6% retracement level of 1.0599 (blue dotted line), and then resume an upward movement.
*এখানে পোস্ট করা মার্কেট বিশ্লেষণ আপনার সচেতনতা বৃদ্ধির জন্য প্রদান করা হয়, ট্রেড করার নির্দেশনা প্রদানের জন্য প্রদান করা হয় না।
ইন্সটাফরেক্স বিশ্লেষণমূলক পর্যালোচনাগুলো আপনাকে মার্কেট প্রবণতা সম্পর্কে পুরোপুরি সচেতন করবে! ইন্সটাফরেক্সের একজন গ্রাহক হওয়ায়, দক্ষ ট্রেডিং এর জন্য আপনাকে অনেক সেবা বিনামূল্যে প্রদান করা হয়।


