


The legend in the InstaSpot team!
Legend! You think that's bombastic rhetoric? But how should we call a man, who became the first Asian to win the junior world chess championship at 18 and who became the first Indian Grandmaster at 19? That was the start of a hard path to the World Champion title for Viswanathan Anand, the man who became a part of history of chess forever. Now one more legend in the InstaSpot team!


Borussia is one of the most titled football clubs in Germany, which has repeatedly proved to fans: the spirit of competition and leadership will certainly lead to success. Trade in the same way that sports professionals play the game: confidently and actively. Keep a "pass" from Borussia FC and be in the lead with InstaSpot!

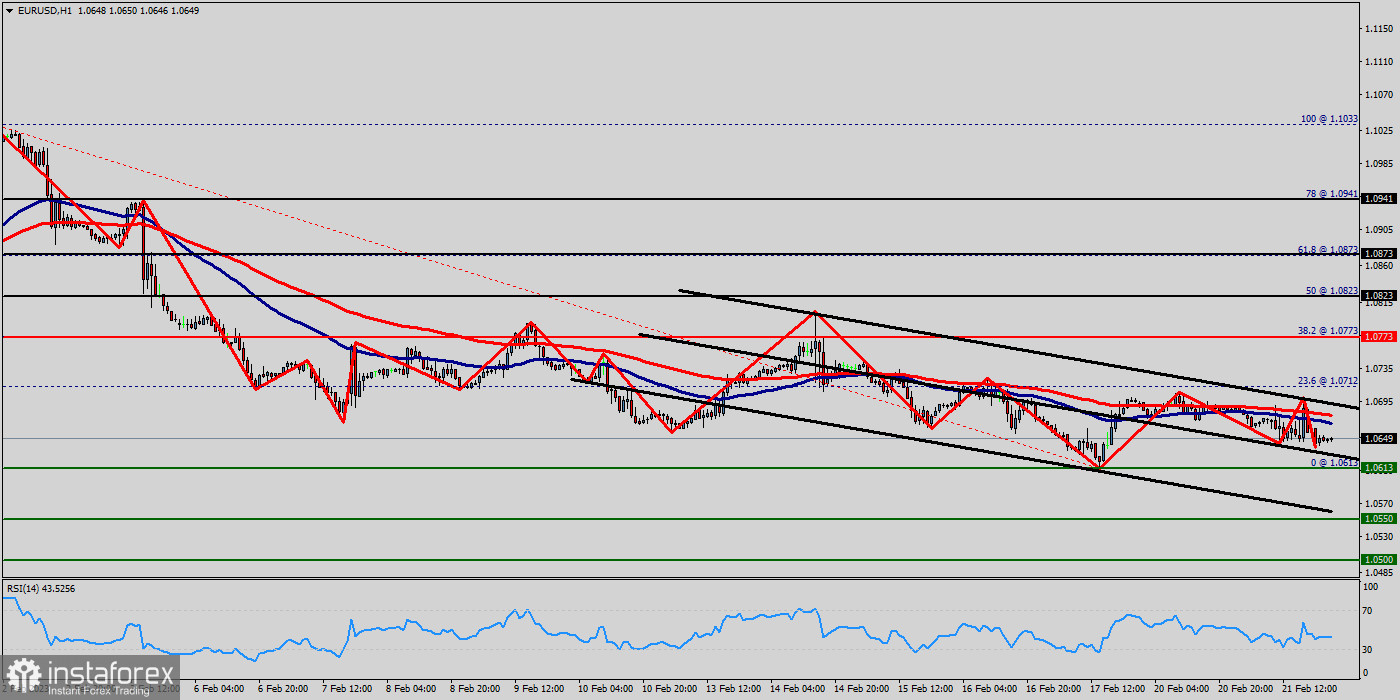
The EUR/USD pair continues to move downwards from the level of 1.0733. Yesterday, the pair dropped from the level of 1.0733 (this level of 1.0733 coincides with the double top - 38.2% of Fibonacci retracement levels) to the bottom around 1.0649. Today, the first resistance level is seen at 1.0712 followed by 1.0733 (the daily pivot point), while daily support 1 is found at 1.0613.
Also, the level of 1.0733 represents a weekly pivot point for that it is acting as major resistance/support this week. Amid the previous events, the pair is still in a downtrend, because the EUR/USD pair is trading in a bearish trend from the new resistance line of 1.0785 towards the first support level at 1.0670 in order to test it. If the pair succeeds to pass through the level of 1.0670, the market will indicate a bearish opportunity below the level of 1.0670.
So, we expect the price to set below the strong (first) support at the level of 1.0670; because the price is in a bearish channel now. The RSI starts signaling a downward trend. Consequently, the market is likely to show signs of a bearish trend. If the trend breaks the major support at 1.0670, the pair will move downwards continuing the bearish trend development to the level 1.0623 in order to test the daily support 2.
The EUR/USD pair is showing signs of strength following a breakout of the lowest level of 1.0550. The market is indicating a bearish opportunity above the above-mentioned support levels, for that the bearish outlook remains the same as long as the 100 EMA is headed to the downside. However, if a breakout happens at the resistance level of 1.0733, then this scenario may be invalidated.
*এখানে পোস্ট করা মার্কেট বিশ্লেষণ আপনার সচেতনতা বৃদ্ধির জন্য প্রদান করা হয়, ট্রেড করার নির্দেশনা প্রদানের জন্য প্রদান করা হয় না।
ইন্সটাফরেক্স বিশ্লেষণমূলক পর্যালোচনাগুলো আপনাকে মার্কেট প্রবণতা সম্পর্কে পুরোপুরি সচেতন করবে! ইন্সটাফরেক্সের একজন গ্রাহক হওয়ায়, দক্ষ ট্রেডিং এর জন্য আপনাকে অনেক সেবা বিনামূল্যে প্রদান করা হয়।


